Good Friday evening to all of you here on r/stocks! I hope everyone on this sub made out pretty nicely in the market this past week, and are ready for the new trading week ahead. 🙂
Here is everything you need to know to get you ready for the trading week beginning May 30th, 2022.
Stocks could build on gains in the week ahead as investors await Friday’s jobs report – (Source)
Stocks could carry the momentum of this latest rally into next week as investors look ahead to Friday’s jobs report.
All three major indice scored big gains in the past week, each rising higher than 6%. Both the S&P 500 and Nasdaq Composite broke a seven-week losing streak, while it had been eight weeks of losses for the Dow Jones Industrial Average.
“I think this is the beginning of that long-awaited relief rally,” said Sam Stovall, chief investment strategist at CFRA Research.
In the four-day week ahead, there are just a handful of earnings, with reports from Salesforce.com, Hewlett Packard Enterprise and online pet retailer Chewy.
The May employment report Friday is the most important data on a calendar that also includes ISM manufacturing, job openings data, monthly vehicle sales and the Federal Reserve’s beige book, all on Wednesday.
“I think the 325,000 consensus [nonfarm payrolls] number, we could easily beat. But it’s just math,” said Alex Chaloff, co-head of investment strategies at Bernstein Private Wealth Management. He noted there could be positive revisions in prior month’s data, as there have been in recent reports.
Economists have expected the pace of job creation to slow from 428,000 jobs in April. “You can’t continue to grow at that type of pace, especially with Covid spiking. That’s a little bit of air cover for the 325,000 number,” said Chaloff.
A recovery after the Fed’s minutes
Stocks in the past week were choppy but moved sharply higher, especially after the Federal Reserve released minutes from its last meeting.
The S&P 500 gained 6.5% to 4,158, the best week since November, 2020. The Dow was up 6.2%, while the Nasdaq was the outperformer, up 6.8%.
“It was waiting for some sort of a catalyst, and I think it got it from the Fed. Not only was it not more hawkish, but it said it would look to expedite the rate tightening,” said Stovall.
“So I think a lot of investors thought they were frontloading the rate hiking cycle, implying they could end up pausing in the third quarter sometime,” he added. “I think that’s what was the rally trigger. The market just got oversold on a breadth and sentiment perspective and was ripe for some sort of good news and the Fed delivered.”
Chaloff said the market is expecting the Federal Reserve to raise interest rates by 50 basis points, or a half percentage point, at each of its next two meetings. That could mean choppy trading through that period, but he added the first time the Fed returns to a quarter-point pace of hiking, the market should rally hard.
“I think this is the early stage of a bounce but we have a Fed meeting in June. We have a Fed meeting in July,” he said. “It will have an impact on markets. It will have jitters when the Fed is acknowledging they have work to do. We’re not saying this is the floor… But it’s great to see markets reacting appropriately to solid macro data.”
For now though, stocks could head higher. “I would say it hasn’t been a really crazy volume week, so it’s nice, it’s fun, it’s great to go into the long weekend, starting the summer with some strength, but the breadth and depth hasn’t been there,” Chaloff said. “I want to say ‘Okay, everybody, we’re not dancing. We’re not there yet’ … We think we’re through the worst of it, but not all of it.”
Looking for catalysts
Chaloff said he will be watching to see if hedge funds, which had been unloading holdings, start to buy in the coming week, a possible positive catalyst for the market.
“These kinds of weeks like this help build on themselves, so while it’s not a breakthrough week, it’s an important week,” he said.
Any developments over the weekend could be important, but weekends are also a time when investors reflect. “If you have a really bad week, and people can’t touch their money for 48 or 72 hours, you really have a bad open to start the week,” Chaloff said.
Bond yields in the past week were lower and steadier. The 10-year yield was at about 2.74% Friday.
“I think it’s positive for stocks and obviously bonds,” Chaloff said. “After seven, eight weeks of outflows you’re starting to get inflows into fixed income instruments of all types, and that keeps yields constrained.”
That is also a positive for growth companies that were the hardest hit as interest rates rose.
Markets close out the month of May on Tuesday. As of Friday, the Dow and S&P 500 were both flattish for the month but negative for the Nasdaq.
Stovall said June is usually positive for the S&P 500. “June has typically few swoons. It’s sort of middling in terms of performance,” he said.
This past week saw the following moves in the S&P:
(CLICK HERE FOR THE FULL S&P TREE MAP FOR THE PAST WEEK!)
S&P Sectors for this past week:
(CLICK HERE FOR THE S&P SECTORS FOR THE PAST WEEK!)
Major Indices for this past week:
(CLICK HERE FOR THE MAJOR INDICES FOR THE PAST WEEK!)
Major Futures Markets as of Friday's close:
(CLICK HERE FOR THE MAJOR FUTURES INDICES AS OF FRIDAY!)
Economic Calendar for the Week Ahead:
(CLICK HERE FOR THE FULL ECONOMIC CALENDAR FOR THE WEEK AHEAD!)
Percentage Changes for the Major Indices, WTD, MTD, QTD, YTD as of Friday's close:
(CLICK HERE FOR THE CHART!)
S&P Sectors for the Past Week:
(CLICK HERE FOR THE CHART!)
Major Indices Pullback/Correction Levels as of Friday's close:
(CLICK HERE FOR THE CHART!)
Major Indices Rally Levels as of Friday's close:
(CLICK HERE FOR THE CHART!)
Most Anticipated Earnings Releases for this week:
([CLICK HERE FOR THE CHART!]())
(T.B.A. THIS WEEKEND.)
Here are the upcoming IPO's for this week:
(CLICK HERE FOR THE CHART!)
Friday's Stock Analyst Upgrades & Downgrades:
(CLICK HERE FOR THE CHART LINK #1!)
(CLICK HERE FOR THE CHART LINK #2!)
It's Over
Spring is meant to be a season of growth, but that's the last way to describe what's been going on in financial markets for the last several weeks. The S&P 500 came into April with a three-week winning streak on Friday, April 1st, but in what has been one of the cruelest April Fools pranks we've ever seen, the S&P 500 was down for seven straight weeks in what was the longest weekly losing streak since March 2001. For the DJIA, the streak was even more extreme with eight straight weekly declines for the longest run of consecutive declines in 99 years. 99 years is a long time.
As shown in the chart below, the streak that ended this week was one of just three other periods where the S&P 500 was down for seven or more straight weeks. The other three were in May 1970 (8 weeks), March 1980 (7 weeks), and March 2001 (8 weeks). Besides relentless selling over several weeks, the other factor these three periods have in common is that they all occurred during recessions. May 1970 was right in the middle of a recession, March 1980 was two months into the first of the 'double-dip' recessions in the early 1980s, and March 2001 came just as the economy was starting to roll over from the dot-bomb fueled contraction. Economists have assured anyone who will listen that the economy isn't close to a recession yet, but then again, in Q1 the economy contracted by 1.5%, and the latest projection from the Atlanta Fed's GDPNow model currently has a forecast of just 1.9% growth for Q2.
(CLICK HERE FOR THE CHART!)
As an investor, whether we're in a recession or not at this point is almost irrelevant. Equities have already fallen sharply. The more important question is where the economy is going. Anyone who has that kind of crystal ball has a distinct advantage. Think about it. When a recession begins, no one watching just the economy ever knows what is about to unfold. They may be thought of as periods of economic weakness and high unemployment, but the start of a recession also coincides with the point at which the economy is at its strongest and firing on all cylinders. The last thing on anyone's mind at that point is a recession.
In terms of the prior streaks where the S&P 500 declined for seven or more weeks in a row, forward performance was mixed but generally positive. Three is admittedly a small sample size, but one, three, six, and twelve months later, the S&P 500 was higher at least two out of three times, and three months later (13 weeks) it was higher all three times. 2022 has been a lousy year so far. Wouldn't it be nice, though, if six months from now at Thanksgiving, instead of everyone worrying about a new emerging strain of COVID (like we did last year), we were all thankful that stocks and bonds stabilized and maybe, just maybe, even partly dug themselves out of the hole they've already put themselves into?
(CLICK HERE FOR THE CHART!)
Stocks Weaker After Memorial Day Recent Years
(CLICK HERE FOR THE CHART!)
The week after Memorial Day performed quite well 1971-95. DJIA & S&P up 68% of the time, averaging 0.8% – DJIA up 12 in a row 1984-95. NAS was up 72% of times, average 0.6%, up 10 straight 1986-95. Since 1979 R2K was up 88% of times, average 0.9%, up 13 straight 1983-95.
Starting in 1996 the week after Memorial Day performance diminished. DJIA was up only 42% of times, average 0.02%, down 8 of last 12. S&P, NAS & R2K all gained ground less than 60% of the time, down 6 of last 12. Huge gains this week in 2000 skew the averages.
(CLICK HERE FOR THE CHART!)
2022 Stock Trader’s Almanac page 100 tracks behavior before & after holidays since 1980. Days after Memorial Day show positivity. But weakness increased the last 21-years the 3 days after Memorial Day. Day after Memorial Day DJIA & NAS down 5 of last 7, S&P down 6 of last 7.
DJIA is on pace to snap its 8-week losing streak. S&P and NASDAQ are set to end their 7-week losing streaks. But all three are already up over 4% from their May lows in just a few days. Russell 2000 has rallied 7% from its 5/11 low.
June’s bullish tendency during the first couple days is visible in the “June Almanac” on page 58 of the 2022 Stock Trader’s Almanac. But this bear market rally could pause next week as stocks flirt with resistance levels today at DJIA 33000, S&P 4100 & NAS 12000.
(CLICK HERE FOR THE CHART!)
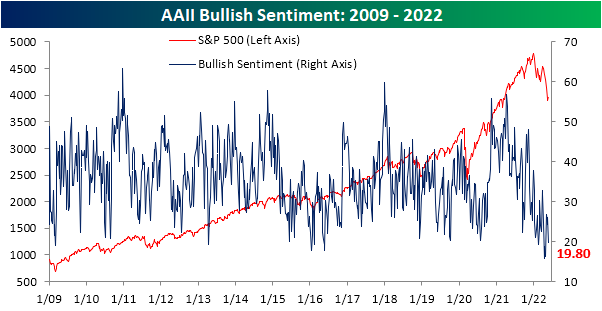
Bulls Back Below 20%
In spite of the S&P 500 actually reversing course and heading higher in the past week, sentiment on the part of individual investors surveyed by the American Association of Individual Investors has turned lower, once again falling below 20%. That is the first sub-20% reading since the last week of April, although the multiple readings in the mid-teens last month were lower than this week's reading.
(CLICK HERE FOR THE CHART!)
The past several months as the major indices have entered downtrends have seen an impressive collapse in optimism. Over the past six months, slightly more than half of the time less than a quarter of AAII respondents have reported as bullish. Going back through the history of the survey beginning in the late 1980s, there have only been two other periods with this same sort of consistently pessimistic attitude for an extended period of time: late 1988 to early 1989 and two years later in early 1991.
(CLICK HERE FOR THE CHART!)
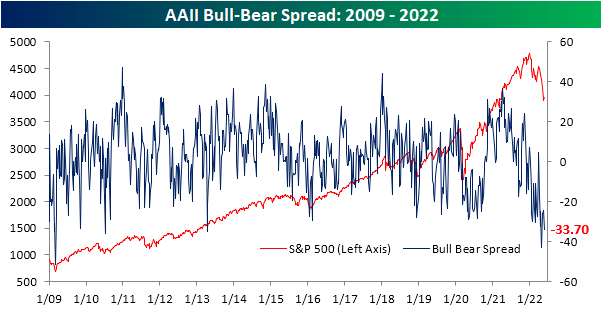
Given bulls were hard to find, bearish sentiment ticked up to 53.5%. Although over half of respondents are expecting lower stock prices, that is still not as high of a reading as the end of April when it was nearly 60%.
(CLICK HERE FOR THE CHART!)
Regardless, bears continue to heavily outweigh bulls as the bull-bear spread has now sat in negative territory for all but two weeks over the past half-year.
(CLICK HERE FOR THE CHART!)
The bearish camp did not pick up all of the losses in bullish sentiment. Neutral sentiment rose back up to 26.7% this week marking the highest reading in a month. That being said, the reading remains below the historical average of 31.43%. Click here to learn more about Bespoke's premium stock market research service.
(CLICK HERE FOR THE CHART!)
One Of The Worst Starts Ever After 100 Days, But There Is Hope
Yesterday was the 100th trading day of the year for 2022 and although stocks managed to gain about 1%, it was still the worst start to a year since 1970 for the S&P 500 Index.
In fact, it is the fourth worst start to a year ever after 100 days, with only 1932 (Great Depression), 1940 (World War II), and 1970 (Vietnam and a recession) worse.
There is actually some good news in there though, as we’ve usually seen the previous worst starts ever come back nicely—sometimes in record fashion. “Down 16.5% after 100 days for the S&P 500 is the worst start to a year since 1970 and one of the worst starts ever,” explained LPL Financial Chief Market Strategist Ryan Detrick. “But the good news is previous bad starts have seen some nice rubber band snap backs and 2022 could be in line to do it once again.”
As shown in the LPL Chart of the Day, the previous five worst starts to a year ever saw the remainder of the year higher every single time, up 19.1% on average compared with the average rest of the year gain of 5.0%. 2022 has been very tough, but most investors would likely take a 19% bounce the rest of the year.
(CLICK HERE FOR THE CHART!)
What Happens After A Bear Market Starts? Four Things To Know
“Life is like riding a bicycle. To keep your balance, you must keep moving.” – Albert Einstein
The S&P 500 Index was down more than 20% on an intraday basis on Friday, but managed a huge rally late to avoid closing down 20% and moving into an official bear market. With the S&P 500 down 18.7% though (as of Friday’s close) a bear market is still quite possible.
Here are four things to know should stocks go into a bear market.
One popular question has been what happens after stocks go into a bear market? “As rough as bear markets are, the good news is the future returns really improve once stocks are down 20%,” explained LPL Financial Chief Market Strategist Ryan Detrick. “In fact, a median gain of nearly 24% a year after a bear market starts may help some beaten-down bulls confidently stay the course.”
(CLICK HERE FOR THE CHART!)
One more look at the table above shows that only three times were stocks lower a year later and all were associated with major recessions. We do not see a recession on the horizon, which could be a clue returns could be strong going out a year.
What about how quickly after a bear market starts do stocks finally stop going down? This one has something for everyone, as the least ever was only 1 day in 1957, while it took 19 months for the bleeding to stop in the early 2000s. Once again though, if the bear happened around a recession, the weakness usually continued much longer and vice versa. 1962, 1966, and 1987 all recovered quickly and didn’t happen in a recession. Meanwhile, stocks did manage to bottom quickly during the recessions of 1957 and 2020. While the recessions of 1974, the early 1980s, dot com burst, and the financial crisis all saw the damage continue for much longer.
(CLICK HERE FOR THE CHART!)
As shown in the LPL Chart of the Day, it took about 19 months on average for stocks to recover their bear market losses. The good news is the past three bear markets recouped losses in 5, 4, and 4 months. Additionally, if the bear market was worse, it took longer to recover. This was not very surprising, but when the bear market decline was less than 22%, it took only seven months on average to make up the losses versus 27 months if the bear was worse than -22%. Should this bear market end soon (our base case), it could bode well for a quicker recovery once again.
(CLICK HERE FOR THE CHART!)
Lastly, there have been a lot of bear markets over time, but one thing that has always happened is stocks have eventually come back to new highs. We do not know when this one will, but we don’t expect this incredible streak to end now.
Investors with longer-term horizons should use this weakness as an opportunity, or Einstein said in the above quote, we’ve got to keep our balance and move forward.
Breaking “the Mondays”
We've talked a lot in the past about how the overwhelming majority of the equity market's gains in the last several decades have come outside of regular trading hours. When you consider the fact that active trading in US equity markets is less than 20% of all the time in a given week, it would make sense that most news occurs outside of trading hours. Therefore, when good news breaks outside of trading hours, stocks typically gap higher in response, and when there's bad news, they gap lower at the next open.
So far, 2022 has generally been a case of the latter. With issues like rising prices, tighter monetary and fiscal policy, and the war in Europe, there really hasn't been much in the way of good news for investors to digest over the weekends, and therefore, when markets do start a new week of trading, performance has been anemic at best. Three charts illustrate this trend.
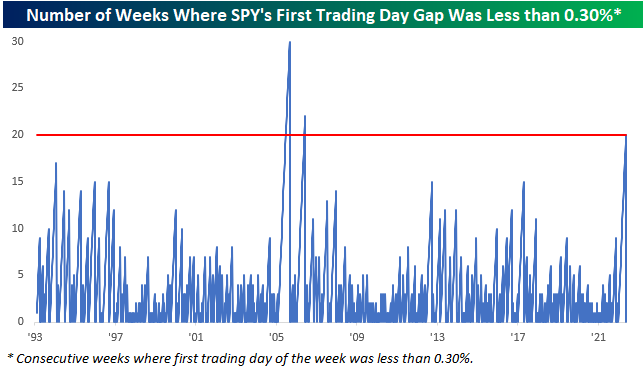
This morning the S&P 500 tracking ETF (SPY) gapped up 0.80% which was the largest upside gap in SPY to kick off a new trading week since late November. Today's strong open also broke a streak of 20 straight weeks where SPY's opening gap to kick off a week was negative or a gain of less than 0.30%. The chart below shows historical streaks where SPY's opening gap on the first trading day of the week was negative or below 0.30%. The streak that just ended was the third-longest in SPY's history, behind the 30-week streak ending August 2005 and the 22-week streak in June 2006. Both of those streaks came in the middle of the Fed's early 2000s rate hike cycle where it raised rates by 25 bps for 17 straight meetings spanning June 2004 through June 2006 and took the Fed Funds Rate from 1.0% to 5.25% in the process.
(CLICK HERE FOR THE CHART!)
Not only has there been a general lack of significant upside pressure to markets to kick off the trading week lately, but the trend has actually been in the opposite direction. Heading into today, SPY gapped lower to kick off the trading week 15 times in the last 19 weeks, and over the last six months, there were only 17 weeks where SPY gapped higher to kick off a week. In the entire history of SPY since the early 1990s, there have only been five other periods where there was a higher frequency of downside gaps to kick off a trading week in a six-month span, and they all peaked at 18.
(CLICK HERE FOR THE CHART!)
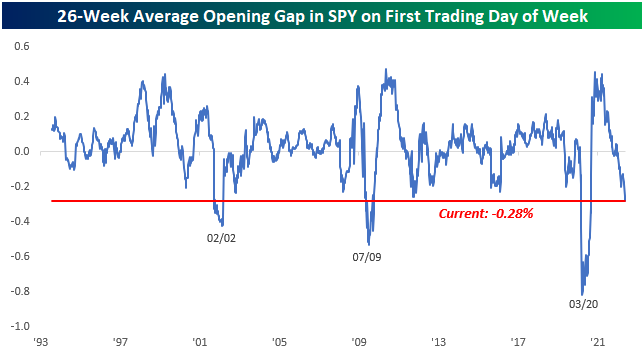
Lastly, with the S&P 500 consistently opening lower to kick off the week, it would only make sense that the six-month average opening gap of the trading week would also be negative, and that's exactly what we have seen. Over the last six months (26-weeks), SPY's average opening gap to kick off a trading week has been a decline of 0.28% which is the weakest reading since the COVID crash (when there was a lot of bad news) and before that, the only two other weaker periods were in the six months ending in July 2009 and February 2002. If you were involved in the market in either of those periods, you remember that there was not a lot to be optimistic about in either period…sort of like now. They call it “the Mondays” for a reason, and lately, equities have had a bad case of them.
(CLICK HERE FOR THE CHART!)
Here are the most notable companies reporting earnings in this upcoming trading week ahead-
- (T.B.A. THIS WEEKEND.)
([CLICK HERE FOR NEXT WEEK'S MOST NOTABLE EARNINGS RELEASES!]())
(T.B.A. THIS WEEKEND.)
(CLICK HERE FOR NEXT WEEK'S HIGHEST VOLATILITY EARNINGS RELEASES!)
(CLICK HERE FOR MONDAY'S PRE-MARKET EARNINGS RELEASES!)
Below are some of the notable companies coming out with earnings releases this upcoming trading week ahead which includes the date/time of release & consensus estimates courtesy of Earnings Whispers:
Monday 5.30.22 Before Market Open:
([CLICK HERE FOR MONDAY'S PRE-MARKET EARNINGS TIME & ESTIMATES!]())
(NONE. U.S. MARKETS CLOSED IN OBSERVANCE OF MEMORIAL DAY.)
Monday 5.30.22 After Market Close:
([CLICK HERE FOR MONDAY'S AFTER-MARKET EARNINGS TIME & ESTIMATES!]())
(NONE. U.S. MARKETS CLOSED IN OBSERVANCE OF MEMORIAL DAY.)
Tuesday 5.31.22 Before Market Open:
(CLICK HERE FOR TUESDAY'S PRE-MARKET EARNINGS TIME & ESTIMATES!
Tuesday 5.31.22 After Market Close:
(CLICK HERE FOR TUESDAY'S AFTER-MARKET EARNINGS TIME & ESTIMATES!)
Wednesday 6.1.22 Before Market Open:
(CLICK HERE FOR WEDNESDAY'S PRE-MARKET EARNINGS TIME & ESTIMATES LINK!)
Wednesday 6.1.22 After Market Close:
(CLICK HERE FOR WEDNESDAY'S AFTER-MARKET EARNINGS TIME & ESTIMATES!)
Thursday 6.2.22 Before Market Open:
(CLICK HERE FOR THURSDAY'S PRE-MARKET EARNINGS TIME & ESTIMATES!)
Thursday 6.2.22 After Market Close:
(CLICK HERE FOR THURSDAY'S AFTER-MARKET EARNINGS TIME & ESTIMATES!)
Friday 6.3.22 Before Market Open:
(CLICK HERE FOR FRIDAY'S PRE-MARKET EARNINGS TIME & ESTIMATES!)
Friday 6.3.22 After Market Close:
([CLICK HERE FOR FRIDAY'S AFTER-MARKET EARNINGS TIME & ESTIMATES!]())
(NONE.)
(T.B.A. THIS WEEKEND.)
(T.B.A. THIS WEEKEND.) (T.B.A. THIS WEEKEND.).
(CLICK HERE FOR THE CHART!)
DISCUSS!
What are you all watching for in this upcoming trading week?
I hope you all have a wonderful holiday 3-day weekend and a great trading week ahead r/stocks. 🙂
Leave a Reply