Good Friday evening to all of you here on r/stocks! I hope everyone on this sub made out pretty nicely in the market this past week, and are ready for the new trading week ahead. 🙂
Here is everything you need to know to get you ready for the trading week beginning July 17th, 2023.
Dow closes 100 points higher Friday on solid earnings, registers best week since March: Live updates – (Source)
The Dow Jones Industrial Average climbed Friday as strong earnings results from some of the biggest banks and companies kicked off earnings season.
The 30-stock Dow added 113.89 points, or 0.33%, to close at 34,509.03 and mark its fifth consecutive day of gains. Meanwhile, the S&P 500 dropped 0.10% to close at 4,505.42. The Nasdaq Composite declined 0.18%, ending at 14,113.70. Both the S&P 500 and the Nasdaq touched their highest intraday levels since April 2022.
On a weekly basis, the Dow notched its best performance since March, up 2.3%. The S&P 500 added 2.4%, and the Nasdaq gained 3.3%.
UnitedHealth shares lifted the blue-chip index Friday as its top performer. The insurance giant jumped more than 7% after it reported better-than-expected adjusted earnings and revenue. The company also raised the lower end of its full-year adjusted earnings guidance. UnitedHealth was also the biggest gainer in the S&P 500′s health-care sector, which advanced 1.5%.
JPMorgan Chase rose 0.6% after its second-quarter earnings topped expectations. The bank was boosted by higher interest rates and rising interest income. Wells Fargo inched down 0.3%, even though the bank posted better-than-expected results.
“What we’ve seen out of big bank earnings, especially JPMorgan, is pretty resilient,” said Scott Ladner, chief investment officer at Horizon Investments.
“We’re seeing right now [that] default rates are still historically incredibly low and not showing signs of skyrocketing higher. So that’s a good sign for consumers and the economy,” Ladner added.
Expectations for this season are downbeat, with analysts forecasting a roughly 7% year-over-year drop in S&P 500 earnings, according to FactSet. That would mark the worst earnings season since the second quarter of 2020, when S&P 500 profits dropped 31.6%.
Investors’ sentiment has been lifted by soft inflation reports this week. The latest producer price index report showed inflation rose less than anticipated and built on trader optimism from the June consumer price index data, which came out Wednesday. Investors are now considering whether a strong economy illustrated by the recent data could push stocks higher by the end of the year.
“The Goldilocks scenario is alive and well, in terms of declining inflation pressures and [there’s] still fairly robust economic growth. So it’s a pretty good backdrop for risk assets,” said Ladner.
This past week saw the following moves in the S&P:
(CLICK HERE FOR THE FULL S&P TREE MAP FOR THE PAST WEEK!)
S&P Sectors for this past week:
(CLICK HERE FOR THE S&P SECTORS FOR THE PAST WEEK!)
Major Indices for this past week:
(CLICK HERE FOR THE MAJOR INDICES FOR THE PAST WEEK!)
Major Futures Markets as of Friday's close:
(CLICK HERE FOR THE MAJOR FUTURES INDICES AS OF FRIDAY!)
Economic Calendar for the Week Ahead:
(CLICK HERE FOR THE FULL ECONOMIC CALENDAR FOR THE WEEK AHEAD!)
Percentage Changes for the Major Indices, WTD, MTD, QTD, YTD as of Friday's close:
(CLICK HERE FOR THE CHART!)
S&P Sectors for the Past Week:
(CLICK HERE FOR THE CHART!)
Major Indices Pullback/Correction Levels as of Friday's close:
(CLICK HERE FOR THE CHART!)
Major Indices Rally Levels as of Friday's close:
(CLICK HERE FOR THE CHART!)
Most Anticipated Earnings Releases for this week:
(CLICK HERE FOR THE CHART!)
Here are the upcoming IPO's for this week:
(CLICK HERE FOR THE CHART!)
Friday's Stock Analyst Upgrades & Downgrades:
(CLICK HERE FOR THE CHART LINK #1!)
(CLICK HERE FOR THE CHART LINK #2!)
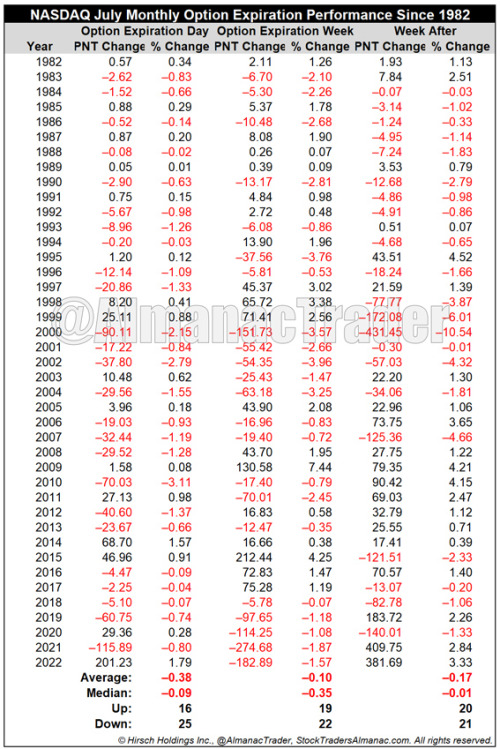
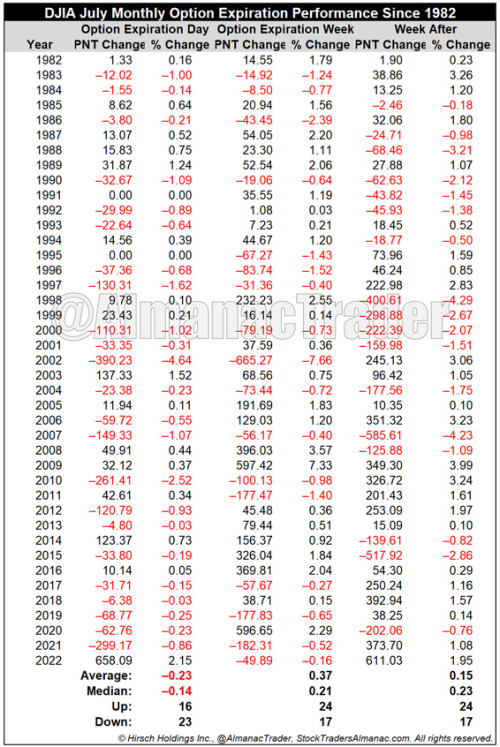
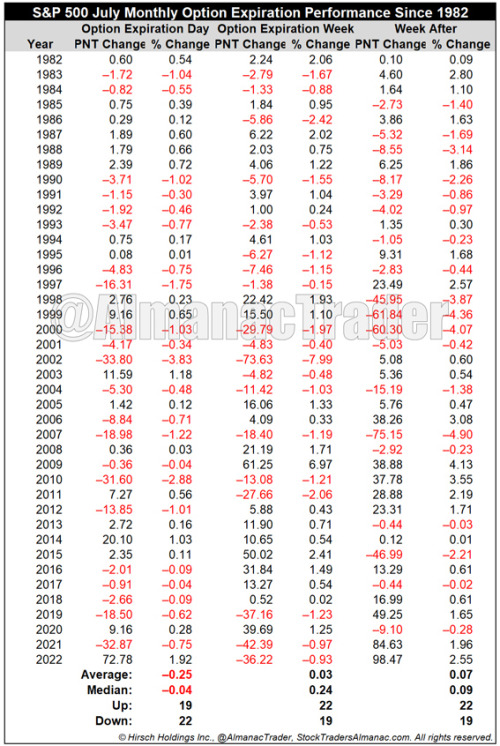
NASDAQ Down 5 Straight During July Monthly Options Expiration Week
(CLICK HERE FOR THE CHART!)
Since 1982, the Friday of monthly options expiration week has a bearish bias for DJIA declining 23 times in 41 years with two unchanged years, 1991 and 1995. On Friday the average loss is 0.23% for DJIA and 0.25% for S&P 500. NASDAQ’s record is even weaker, down 25 of 41 years with an average loss of 0.38%. DJIA posts the best full-week performance, up 24 of 41 with an average 0.37% gain. However, NASDAQ has been weakest, down 22 times and the last five straight. The week after monthly options expiration leans bearish for NASDAQ over the longer-term with an average loss. In recent years the track record had been improving until 2015’s across the board, greater than 2% loss.
(CLICK HERE FOR THE CHART!)
(CLICK HERE FOR THE CHART!)
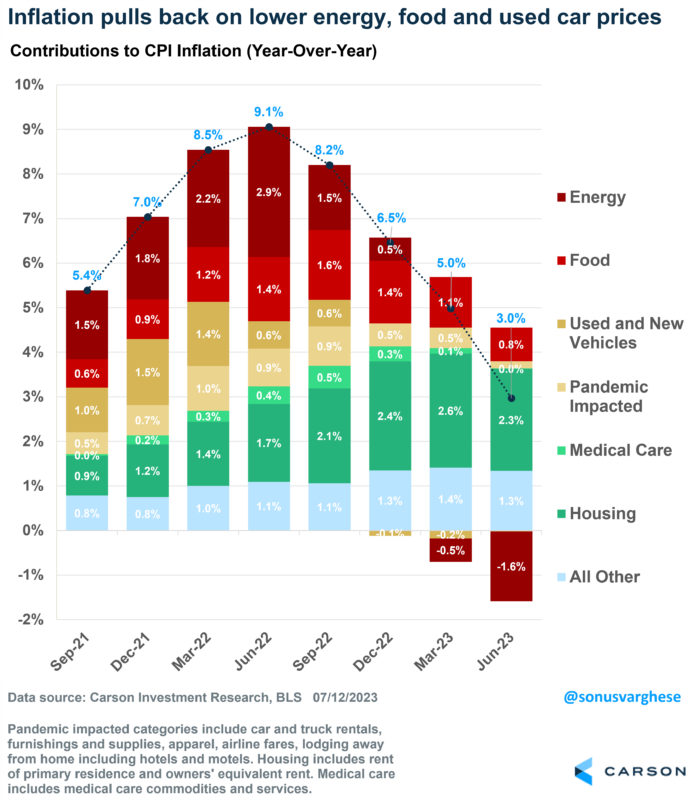
The Path to Lower Inflation is Now Clear
The June CPI report was a positive surprise, both in terms of the headline numbers as well as the underlying details.
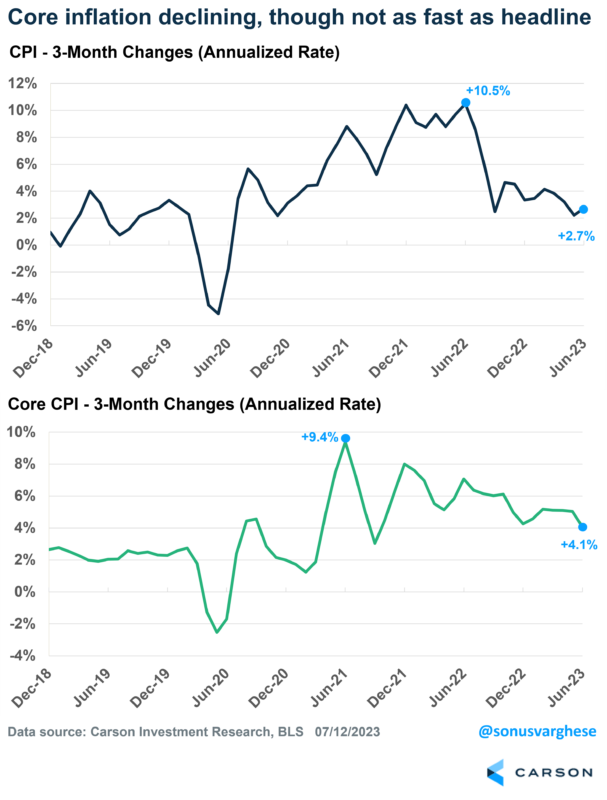
Headline inflation rose 0.2% in June, which translates to a 2.2% annual pace. Over the past three months, inflation’s averaged about 2.7%, and over the last year it’s up 3.0%. That’s well off the peak pace of over 9% exactly a year ago.
In my opinion, the reason for the decline is obvious when you look at the chart below. Energy prices drove the inflation surge in 2022, especially after Russia’s invasion of Ukraine. Energy prices have now declined 17% over the past year, pulling inflation lower. The good news is that food inflation is also easing a lot, rising at an annual pace of just 1.3% over the past 3 months. Remember the surge in egg prices? Well, egg prices have fallen 21% over the past 3 months.
(CLICK HERE FOR THE CHART!)
All this of course has been occurring for a few months now and shouldn’t be a big surprise.
The problem until now was that “core inflation,” i.e., inflation once you strip out energy and food prices, remained elevated. But we got good news on that front.
Core inflation rose just 0.16% in June, which translates to a 1.9% annual pace — the slowest monthly pace since August 2021! That’s great, but as you can see below, the 3-month pace remains above 4%. So, we’ve yet to see a consistent deceleration in core inflation, which is what the Federal Reserve is looking for.
(CLICK HERE FOR THE CHART!)
Positive signs
We realize that one month does not make a trend, but a lot of the underlying details point to downward momentum. Let’s look at a few of these.
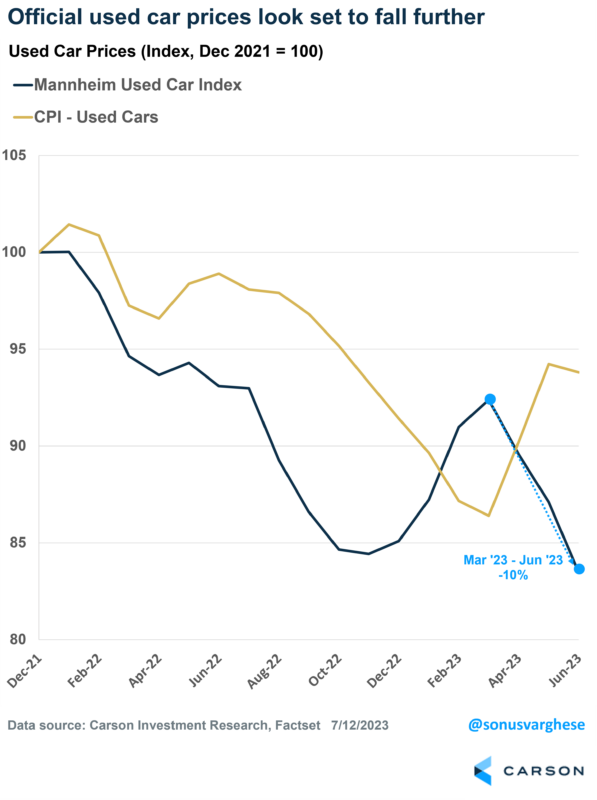
Used and new vehicle prices, which make up 9% of the core inflation “basket,” have reversed a lot over the past year. However, used car prices rose in April and May, reversing some of that momentum. But things look to have turned around once again, with used car prices falling 0.5% in June. In fact, prices are likely to fall further over the next few months based on private used car auction data (Ryan pointed this out in his previous blog as well).
(CLICK HERE FOR THE CHART!)
Moreover, the auto production supply chain bottlenecks are being resolved, and therefore we’re seeing vehicle production increase. As a result, prices for new vehicles have fallen about 0.4% over the past three months, and that downtrend is likely to continue given increased supply.
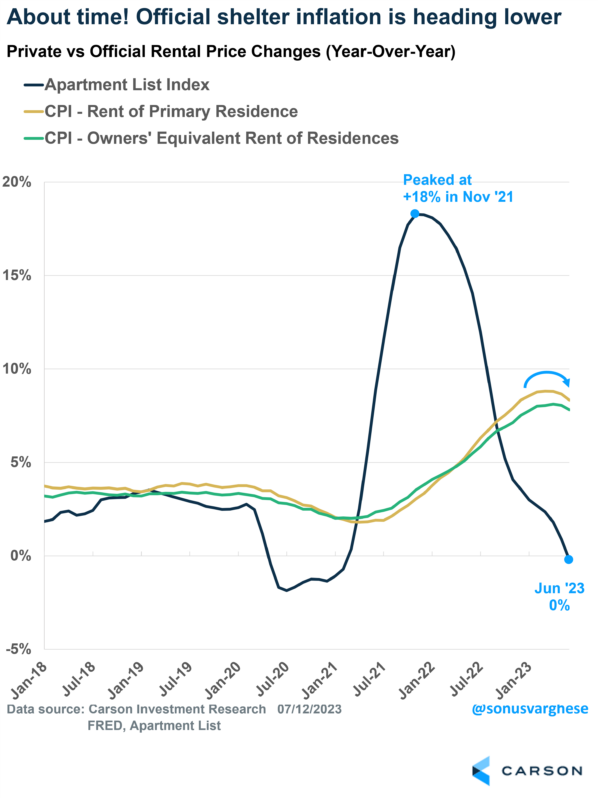
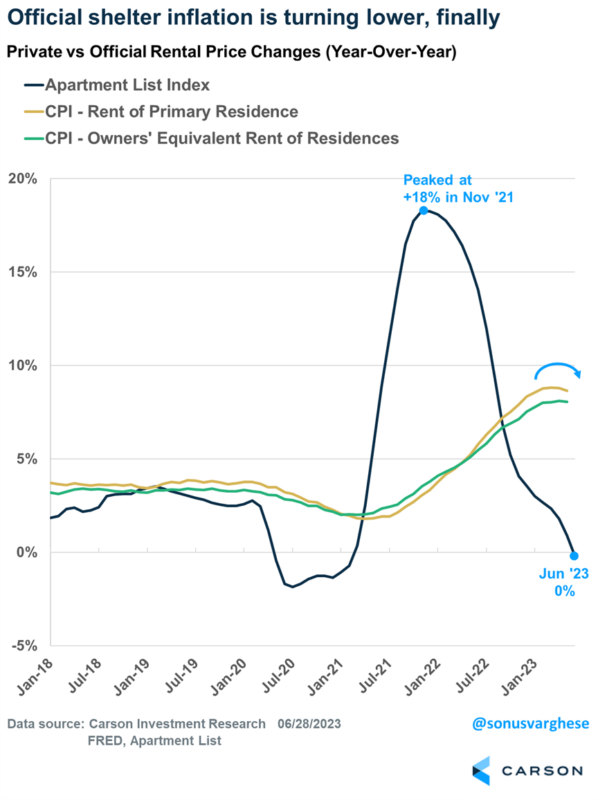
The big one is housing inflation, which Ryan and I have been talking a lot about over the past year. Housing makes up 40% of core inflation, but importantly, it does not include home prices. Instead, it’s based on rents. The problem is that there is a significant lag between official rental inflation and private rents data. Private data from Apartment List shows that rents have decelerated from a peak of 18% year-over-year pace to zero as of June! Official data lags this data by about 12 months or so and it’s taken a while to reflect market reality.
The good news is that official rental inflation appears to be turning lower. Rental inflation was averaging a 9% annual pace between June 2022 and February 2023. However, that’s fallen to about 6% over the past 4 months. That’s still higher than the 2018-2019 average of about 3-3.5%. But given what we’re seeing in market rents, we expect housing inflation to continue decelerating and that’s going to pull core inflation down in a big way later this year and into 2024 as well.
(CLICK HERE FOR THE CHART!)
What about the rest?
Fed Chair Powell has cited “core services ex housing” as still being elevated. We believe it’s their way of saying,
“Yes, we see vehicle prices heading lower, and acknowledge the lags in housing inflation data; but we want to see the rest of it fall”
But there’s good news on that front too.
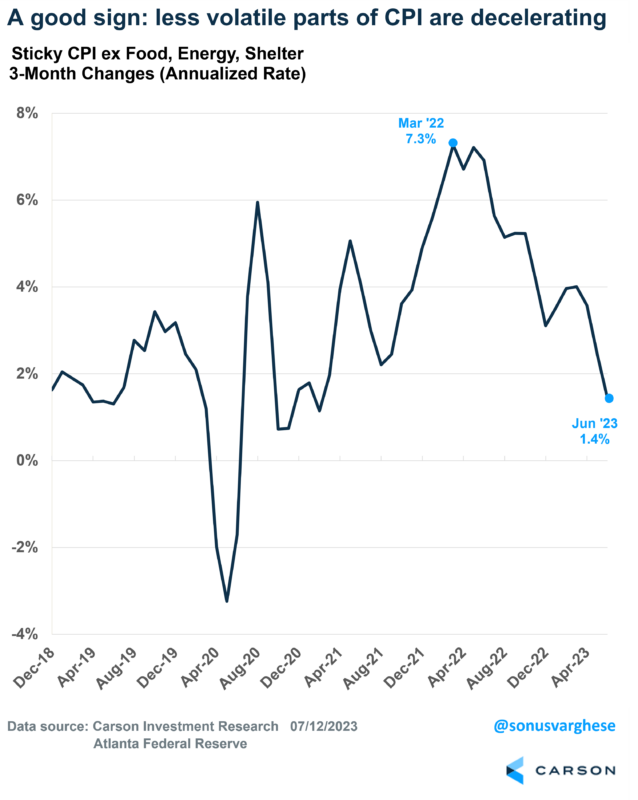
The Atlanta Federal Reserve calculates something called the “Sticky Price CPI excluding food, energy, and shelter.” Simply put, it measures inflation for items whose prices typically don’t change frequently.
In June, this sticky price measure was flat. Over the past 3 months it’s running at a 1.4% annual pace, well below the peak of 7.3% we saw 15 months ago. A key piece of this is restaurant food prices, which have slowed down a lot recently on the back of falling food prices. But even things like airfares, daycare and pet care services inflation have been falling.
(CLICK HERE FOR THE CHART!)
You can see why the June inflation report was positive from so many angles. A low reading is positive by itself, but it also confirmed what we know from other sources about what to expect going forward.
Perhaps the best news is that inflation is falling, and poised to fall even further, without a rise in unemployment and an economic slowdown. A year ago, Federal Reserve officials and many economists were saying that we probably need to go into a recession for inflation to slow down, and that aggressive rate hikes by the Fed would push us into one.
Instead, the unemployment rate is at 3.6%, close to 50-year lows. If real GDP growth clocks in around 2% for last quarter (as seems likely), that would mean the economy’s grown at a 2.5% pace over the past year. While inflation’s fallen from 9% to 3%. That’s huge!
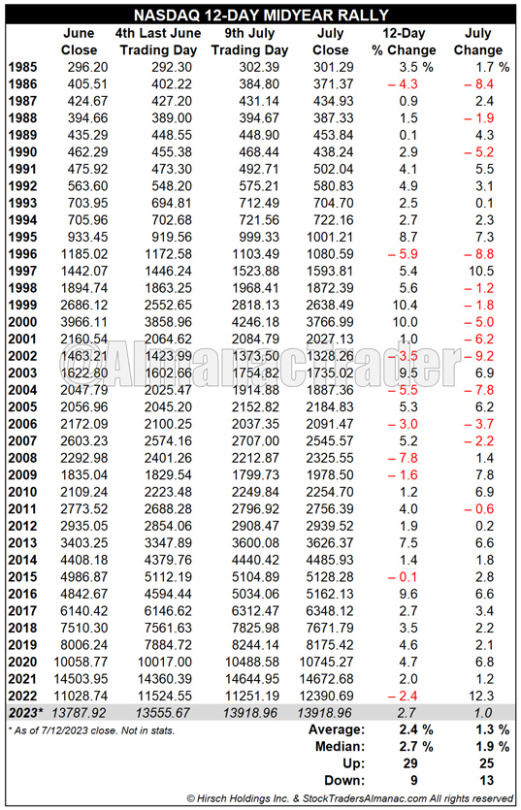
NASDAQ’s Midyear Rally Ends on Friday
(CLICK HERE FOR THE CHART!)
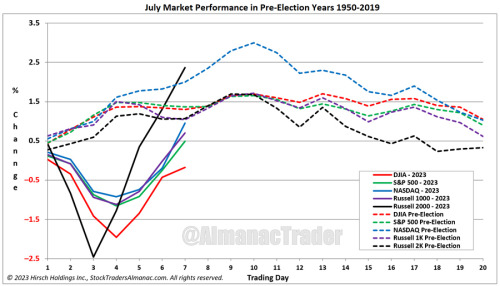
From its close on June 27 (the fourth from last trading day) through today, NASDAQ has gained 2.7% which makes this year’s NASDAQ midyear rally slightly better than average. Today’s gains were largely fueled by better than anticipated CPI reading. Provided this translates into a better-than-expected PPI report tomorrow, additional gains are likely before NASDAQ’s midyear rally officially ends on Friday, July 14. The end of the rally also coincides with the historical seasonal mid-month July market peak in pre-election years. Since 1950, the second half of July has been weaker than the first half.
(CLICK HERE FOR THE CHART!)
Inflation Expectations Still on the Decline
Ahead of Wednesday's CPI, the New York Fed's Survey of Consumer Expectations (SCES) was released earlier this week and showed a continuation of the trend where consumer inflation expectations have been falling. Over the next 12 months, the Fed's survey showed that the median expected rate of inflation fell from 4.07% down to 3.83%. While still above its historical average of 3.4%, consumer expectations for inflation over the next year are down to the lowest level since April 2021. Over a longer time horizon, inflation expectations haven't fallen nearly as fast, but they didn't rise anywhere near as much as short-term expectations either. In the June survey, the median expected rate of inflation over the next three years fell from 2.98% down to 2.95%. While that reading barely budged, we would note that current expectations for inflation over the next three years are slightly below the long-term average. Unlike the FOMC, which ditched the term transitory 18 months ago, consumers have remained on team transitory.
(CLICK HERE FOR THE CHART!)
One issue which has the potential to push inflation higher is how consumers expect their incomes to change over time. In this month's survey, the median expected rate of earnings growth increased from 2.80% up to 2.98% which is right around the high end of its range from the last two years. As shown in the chart below, while this series has tested the 3% level multiple times, it hasn't been able to bust through it. As it pertains to inflation, that's a good thing, because if consumers expect their incomes to increase, they're probably also less likely to push back on higher prices. At the same time, the fact that this reading has settled into a new higher range relative to its long-term average suggests that getting back down to and staying at levels of inflation that prevailed before COVID may prove to be difficult.
(CLICK HERE FOR THE CHART!)
Small-caps Catch a Bid
Small-caps have caught a bid over the last few days with the Russell 2,000 ETF (IWM) rallying more than 3% since last Thursday's close. Over the same time frame, the large-cap S&P 500 is up just 0.3%.
While large-cap indices have recently traded to 52-week highs, small-caps are still well below 2023 highs made back in Q1. As shown below, though, IWM is currently attempting to break above the top end of the sideways range it has been in over the last month. If it can do that, the highs from earlier in the year will come into sight.
(CLICK HERE FOR THE CHART!)
The Russell 2,000 (IWM) chart looks pretty interesting over a multi-year time frame. As shown below, the pre-COVID high made in early 2020 has acted as strong support over the past year. While IWM fell sharply during the mini-banking crisis this March, it stopped going down once it reached this key support level, and then it traded sideways and consolidated throughout much of April and May. Going forward, it appears that the Russell has built a strong base over the past year to springboard off of if the bull market for US equities can continue.
(CLICK HERE FOR THE CHART!)
A chart that always captures our attention is the one below that shows Apple's (AAPL) market cap versus the combined market cap of all of the stocks in the small-cap Russell 2,000. Prior to COVID, Apple's market cap wasn't even close to the $2+ trillion market cap of the Russell 2,000. Since late 2021, though, the two have been battling it out. After its huge gain in Q2, Apple is currently in the lead at $2.96 trillion, but the Russell isn't too far behind at $2.81 trillion.
(CLICK HERE FOR THE CHART!)
Here We Go Again
“Here I go again on my own. Going down the only road I’ve ever known.”
-Here I Go Again by Whitesnake
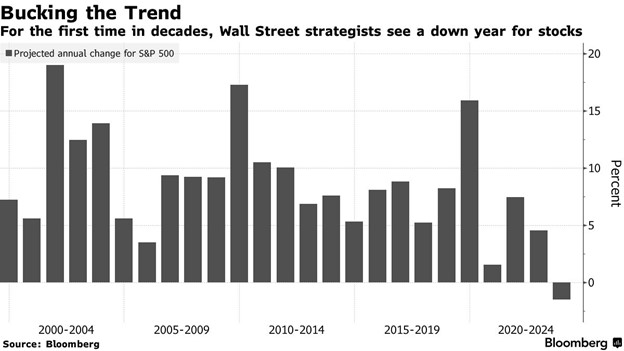
One of the main reasons we came into 2023 overweight equities (when everyone else was talking recessions and bear markets) was the over-the-top negativity. Rarely is the crowd and obvious trade right when it comes to investing and we assumed should we get any good news, stocks could surprise to the upside. One of the most staggering signs of negativity was the median strategist in this Bloomberg survey was looking for negative stock returns in ’23.
(CLICK HERE FOR THE CHART!)
As we noted in Is Anyone Bullish? (from December 11, 2022), we’d never seen strategists this bearish heading into a new year. Then layer on the fact that stocks were down close to 20% in 2022 and the odds greatly favored a big bounce back year, as stocks were rarely down two years a in a row. Not to mention, the macro backdrop was on much better footing than the M2 is crashing, LEI is down, and yield curve fearmongers were telling us.
All that happened was that the first six months of this year was the second best start to a year since 2000 for the S&P 500, best start for the NASDAQ in 40 years and the best start ever for the NASDAQ-100.
Where are we now? Well, similar to the great Whitesnake song in the quote above, here I go again, down the only road I’ve ever known.
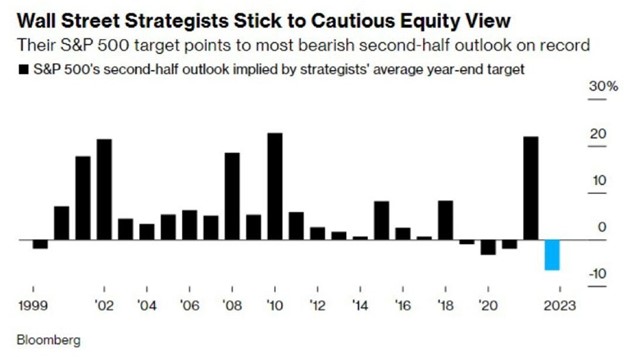
Apparently, the only road these strategists know is doubling down on lower prices, as they expect the most bearish second half EVER. We’ll gladly take the other side to this, as we expect stocks to gain nicely the rest of this year, likely to new all-time highs.
(CLICK HERE FOR THE CHART!)
Take note the other years they expected lower prices during the final six months of the year were 1999, 2019, 2020, and 2021. All the S&P 500 did those years was gain 7.0%, 9.8%, 21.2%, and 10.9%, respectively, over the final six months. That comes out to a very impressive 12.2% average, not bad, not bad.
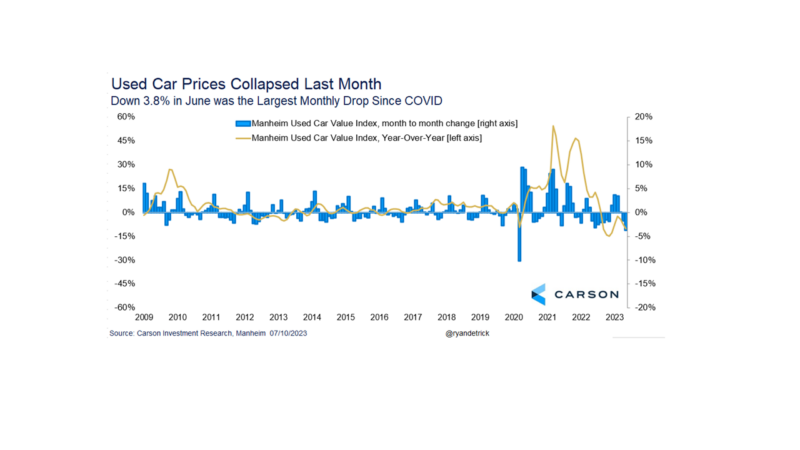
What also has my attention? We have some big inflation data out this week, but we’ve already seen some nice signs that inflation could surprise to the downside. First up, used cars accounted for nearly a third of the jump in inflation the past few years, but it is crashing lower, with used car prices experiencing their largest monthly drop since COVID. Given light auto production is running close to pre-COVID levels, this is another sign supply chains are working again and price pressures are abating.
(CLICK HERE FOR THE CHART!)
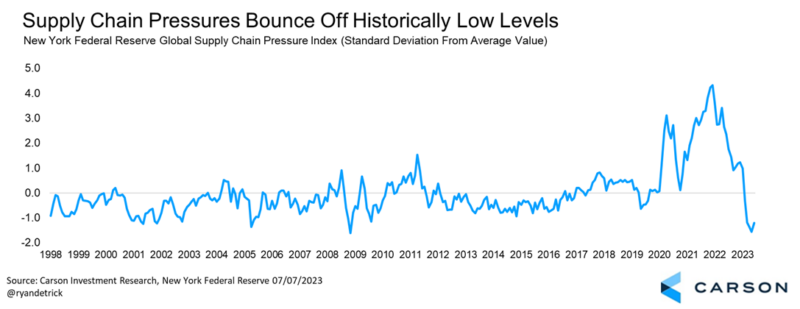
Speaking of supply chains, the New York Fed Global Supply Chain Pressure Index did jump last month, but it was coming off of the lowest level in history. Bottom line, supply chains are back to normal after years of disruptions.
(CLICK HERE FOR THE CHART!)
Along with supply chains and used car prices improving, we expect to see shelter take a big dive the second half of this year. Remember, shelter makes up more than 40% of CPI and it has stayed stubbornly high lately. Well, we’ve seen drastic improvements from private data places like Apartment List and Zillow, suggesting that the government’s data will likely follow suit soon.
(CLICK HERE FOR THE CHART!)
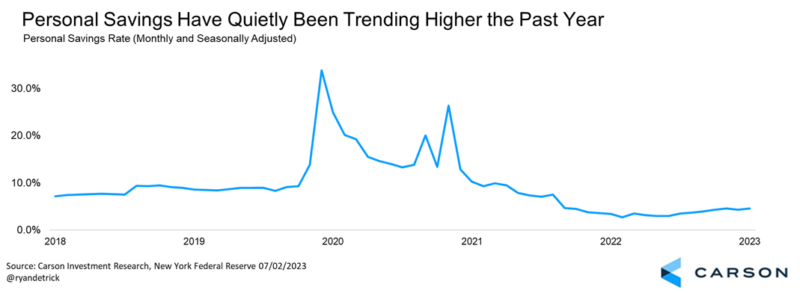
Lastly, we’ve been hearing a lot that the trillions of dollars in excess savings that consumers had over COVID was nearly all the way gone. The media are spinning this as a bearish event, as it means consumers aren’t saving anymore and they will run out of money to spend and keep the economy growing. Here’s the issue with that, the savings rate has been trending higher the past year and is more than two percent higher than it was in early 2022. The employment backdrop is still healthy, spending is solid and consumer confidence is improving. To us, all of that is positive.
(CLICK HERE FOR THE CHART!)
Here is the list of notable tickers reporting earnings in this upcoming trading week ahead-
(T.B.A. THIS WEEKEND.)
(CLICK HERE FOR NEXT WEEK'S MOST NOTABLE EARNINGS RELEASES!)
([CLICK HERE FOR NEXT WEEK'S HIGHEST VOLATILITY EARNINGS RELEASES!]())
(T.B.A. THIS WEEKEND.)
([CLICK HERE FOR MONDAY'S PRE-MARKET NOTABLE EARNINGS RELEASES!]())
(N/A.)
DISCUSS!
What are you all watching for in this upcoming trading week?
I hope you all have a wonderful weekend and an awesome trading week ahead r/stocks. 🙂
Leave a Reply