Good Friday evening to all of you here on r/stocks! I hope everyone on this sub made out pretty nicely in the market this week, and are ready for the new trading week ahead. 🙂
Here is everything you need to know to get you ready for the trading week beginning February 27th, 2023.
Stocks close lower Friday after hot inflation report; major averages log worst week in 2023: Live updates – (Source)
U.S. stocks fell sharply Friday, wrapping up their worst week of 2023, after the Federal Reserve’s preferred inflation gauge showed a stronger-than-expected increase in prices last month.
The Dow Jones Industrial Average fell by 336.99 points, or 1.0%, to end at 32,816.92. The S&P 500 dropped 1% to close at 3,970.04. The Nasdaq Composite slid 1.7% to end at 11,394.94. The Dow fell as much as 510 points, or 1.54%, earlier in the trading session.
The major averages also ended the week with their biggest losses in 2023. The S&P 500 was down 2.7%, marking its worst week since Dec. 9. The Dow fell almost 3.0% this week — its fourth straight losing week. The Nasdaq closed 3.3% lower, notching its second negative week in three.
Boeing shares slipped more than 4% after the company temporarily halted delivery of its 787 Dreamliners over a fuselage issue. Shares of Microsoft and Home Depot fell 2.2% and 0.9%, respectively.
The core personal consumption expenditures price index, the Fed’s preferred measurement of inflation, rose 0.6% in January and 4.7% from the prior year, coming in above economists’ expectations.
The report added to worries that the Fed may have to keep rates higher for longer to quell inflationary pressures.
Liz Ann Sonders, chief investment strategist at Charles Schwab, believes there is more to the market’s downturn besides the PCE numbers.
“Another reason why the market is having trouble to some degree, I think, is not just about inflation being hotter or concerns that the Fed has to stay tighter for longer,” Sonders said on Friday.
“But there was just a lot of speculation that kicked back in —speculative froth. And the market tends to move in a contrarian fashion when sentiment gets a little too frothy. So I think some of the move has has to do with sentiment. Not just these macro forces,” she added.
The strategist believes that inflation cannot come down without a broader economic downturn.
“I think something would have to give either broadly in the economy, or more specifically in the labor market, to bring the immaculate disappearance of inflation,” Sonders said. “Without that commensurate hit to the economy or the labor market, I think it’s a stretch.”
This past week saw the following moves in the S&P:
(CLICK HERE FOR THE FULL S&P TREE MAP FOR THE PAST WEEK!)
S&P Sectors for this past week:
(CLICK HERE FOR THE S&P SECTORS FOR THE PAST WEEK!)
Major Indices for this past week:
(CLICK HERE FOR THE MAJOR INDICES FOR THE PAST WEEK!)
Major Futures Markets as of Friday's close:
(CLICK HERE FOR THE MAJOR FUTURES INDICES AS OF FRIDAY!)
Economic Calendar for the Week Ahead:
(CLICK HERE FOR THE FULL ECONOMIC CALENDAR FOR THE WEEK AHEAD!)
Percentage Changes for the Major Indices, WTD, MTD, QTD, YTD as of Friday's close:
(CLICK HERE FOR THE CHART!)
S&P Sectors for the Past Week:
(CLICK HERE FOR THE CHART!)
Major Indices Pullback/Correction Levels as of Friday's close:
(CLICK HERE FOR THE CHART!)
Major Indices Rally Levels as of Friday's close:
(CLICK HERE FOR THE CHART!)
Most Anticipated Earnings Releases for this week:
(CLICK HERE FOR THE CHART!)
Here are the upcoming IPO's for this week:
(CLICK HERE FOR THE CHART!)
Friday's Stock Analyst Upgrades & Downgrades:
(CLICK HERE FOR THE CHART LINK #1!)
(CLICK HERE FOR THE CHART LINK #2!)
(CLICK HERE FOR THE CHART LINK #3!)
Mixed Signals
There's a ton of debate over whether or not the S&P 500's 2022 closing low in October marked the start of a new bull market (20%+ rally on a closing basis without a 20% decline in between) or was just a pause in what is likely to be another leg lower. From the bear's perspective, the tepidness of the rally off those October lows stands out. Already more than four months past those lows, the S&P 500 is only up 10.8%, and its maximum gain was 16.9%. It's often said, that bottoms tend to be so short-lived that the market gives investors a narrow window to get in near the lows, but here we are 135 days removed from that October low, and the S&P 500 still hasn't reached the 20% threshold for a bull market. To put that in perspective, to find a bull market where it took the S&P 500 longer to reach the 20% bull market threshold, you have to go back to 1962; the ten bull markets between then and now all reached the 20% point faster and the average number of days that elapsed from the closing low to 20% was 57 days.
Although the market's rally off the October lows has been relatively muted, sector leadership since those lows has hardly been led by defensive sectors. As shown in the chart below, Utilities, Consumer Staples, and Health Care are all up since those October lows, but all three are also underperforming the S&P 500. Meanwhile, cyclical sectors like Materials, Industrials, Financials, and Technology are all handily outperforming the S&P 500. In addition, despite all the concern about higher rates, the Real Estate sector has still managed to outperform.
(CLICK HERE FOR THE CHART!)
Looking more recently at sector performance YTD, it's a similar trend. Consumer Discretionary, Technology, and Communication Services have all outperformed the S&P 500 by a factor of at least 2x while defensive-oriented sectors are not only underperforming the market, but they're also down YTD. The market may not exactly be following the bull market playbook, but sector leadership isn't following a recessionary playbook either.
(CLICK HERE FOR THE CHART!)
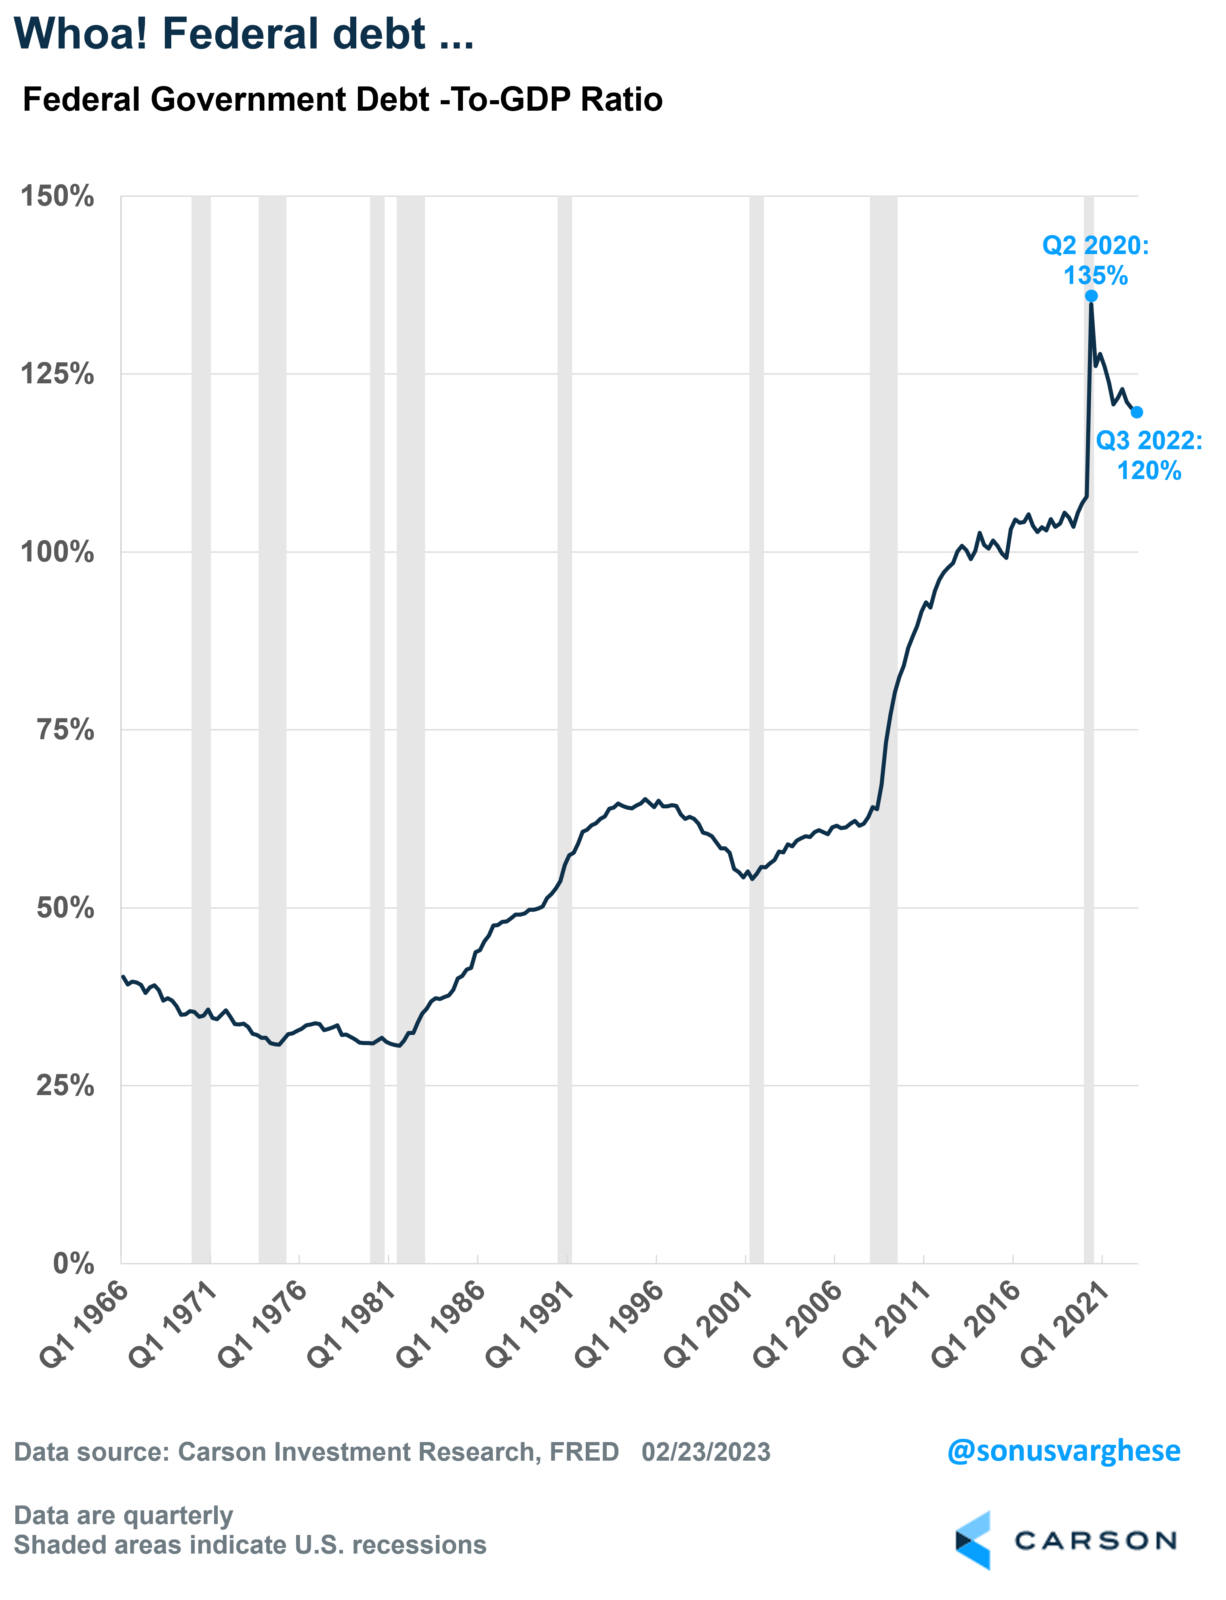
Can the US Manage Its Debt?
The US national debt is about $31 trillion right now, which is equivalent to about 120% of GDP (as of the third quarter of 2022). Massive, but also note that this is down from a peak of 135% in the second quarter of 2020.
(CLICK HERE FOR THE CHART!)
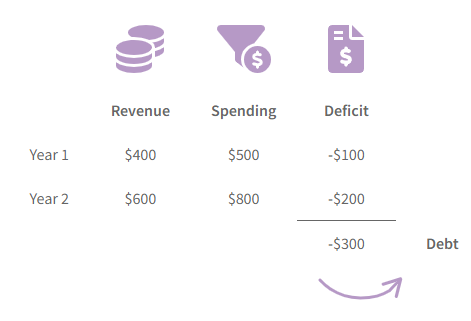
As a point of clarification, the US government typically racks up a deficit each year: which is the amount by which spending exceeds revenues. And accumulated deficits over time represent the national debt. Here’s a helpful graphic from the US treasury:
(CLICK HERE FOR THE CHART!)
Here’s the thing though: looking at debt-to-GDP is sort of like calculating your mortgage balance-to-income ratio. Using the average mortgage debt of $346,000 as of September 2022 and median household income of $71,00, the “debt-to-income” ratio is just under 500%! There’s a reason nobody quotes this number. Of course, GDP is not technically the government’s “income” – only a portion of it is (via taxes).
Anyway, what really matters is the government’s (or households’) ability to service their debt. And interest rates are a key variable there.
With rising interest rates, how can the US manage its debt service?
This is a frequent question that we get.
The short, perhaps glib, answer is Yes. The US can always “manage” debt service because it prints its own currency. And that’s a crucial difference to understand between the US government and you and me – we can’t “print money” to pay off our debt. Or rather, we can print IOUs, but nobody will accept them.
In all seriousness, US treasuries are considered the safest asset in the world, which includes the belief that the US government will not simply “print money” to service and pay back its debt. So, let’s consider the question of whether the US can manage its debt.
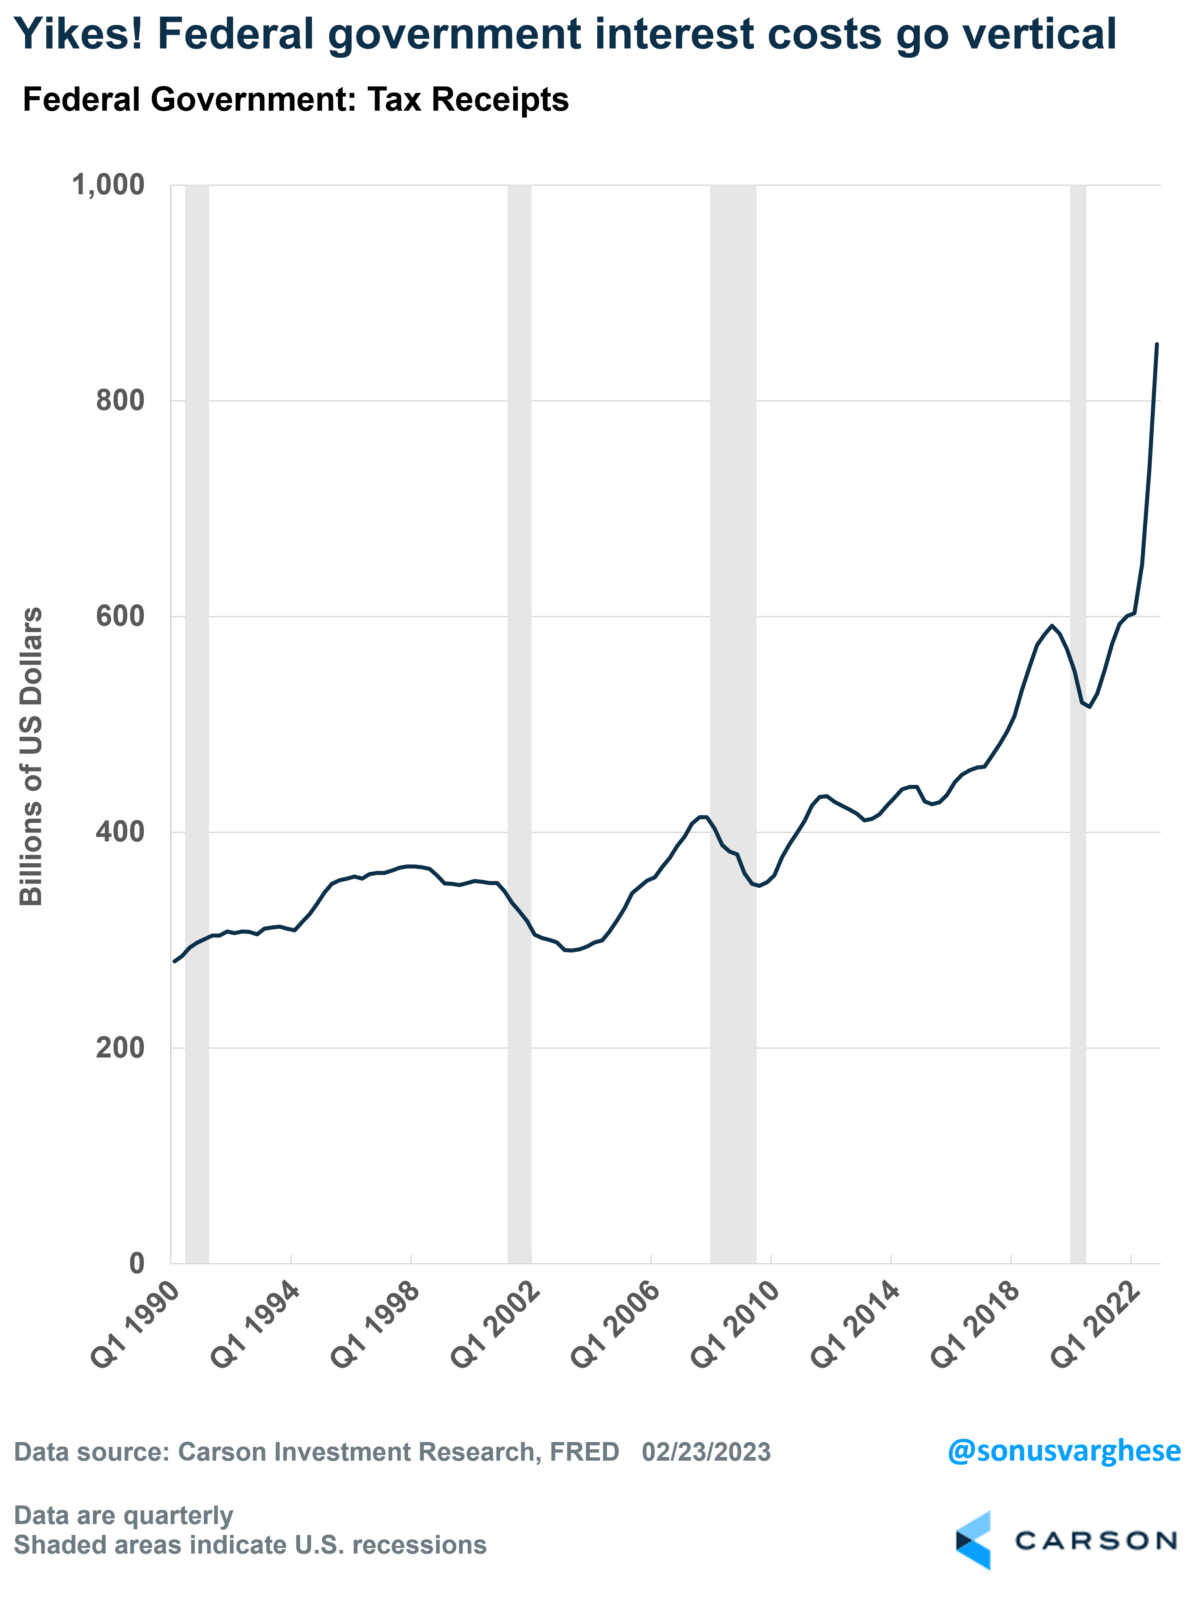
As you can see from the chart below, interest costs for the Federal Government have exploded higher. This is due to rising interest rates as well as the massive increase in debt over 2020-2021.
(CLICK HERE FOR THE CHART!)
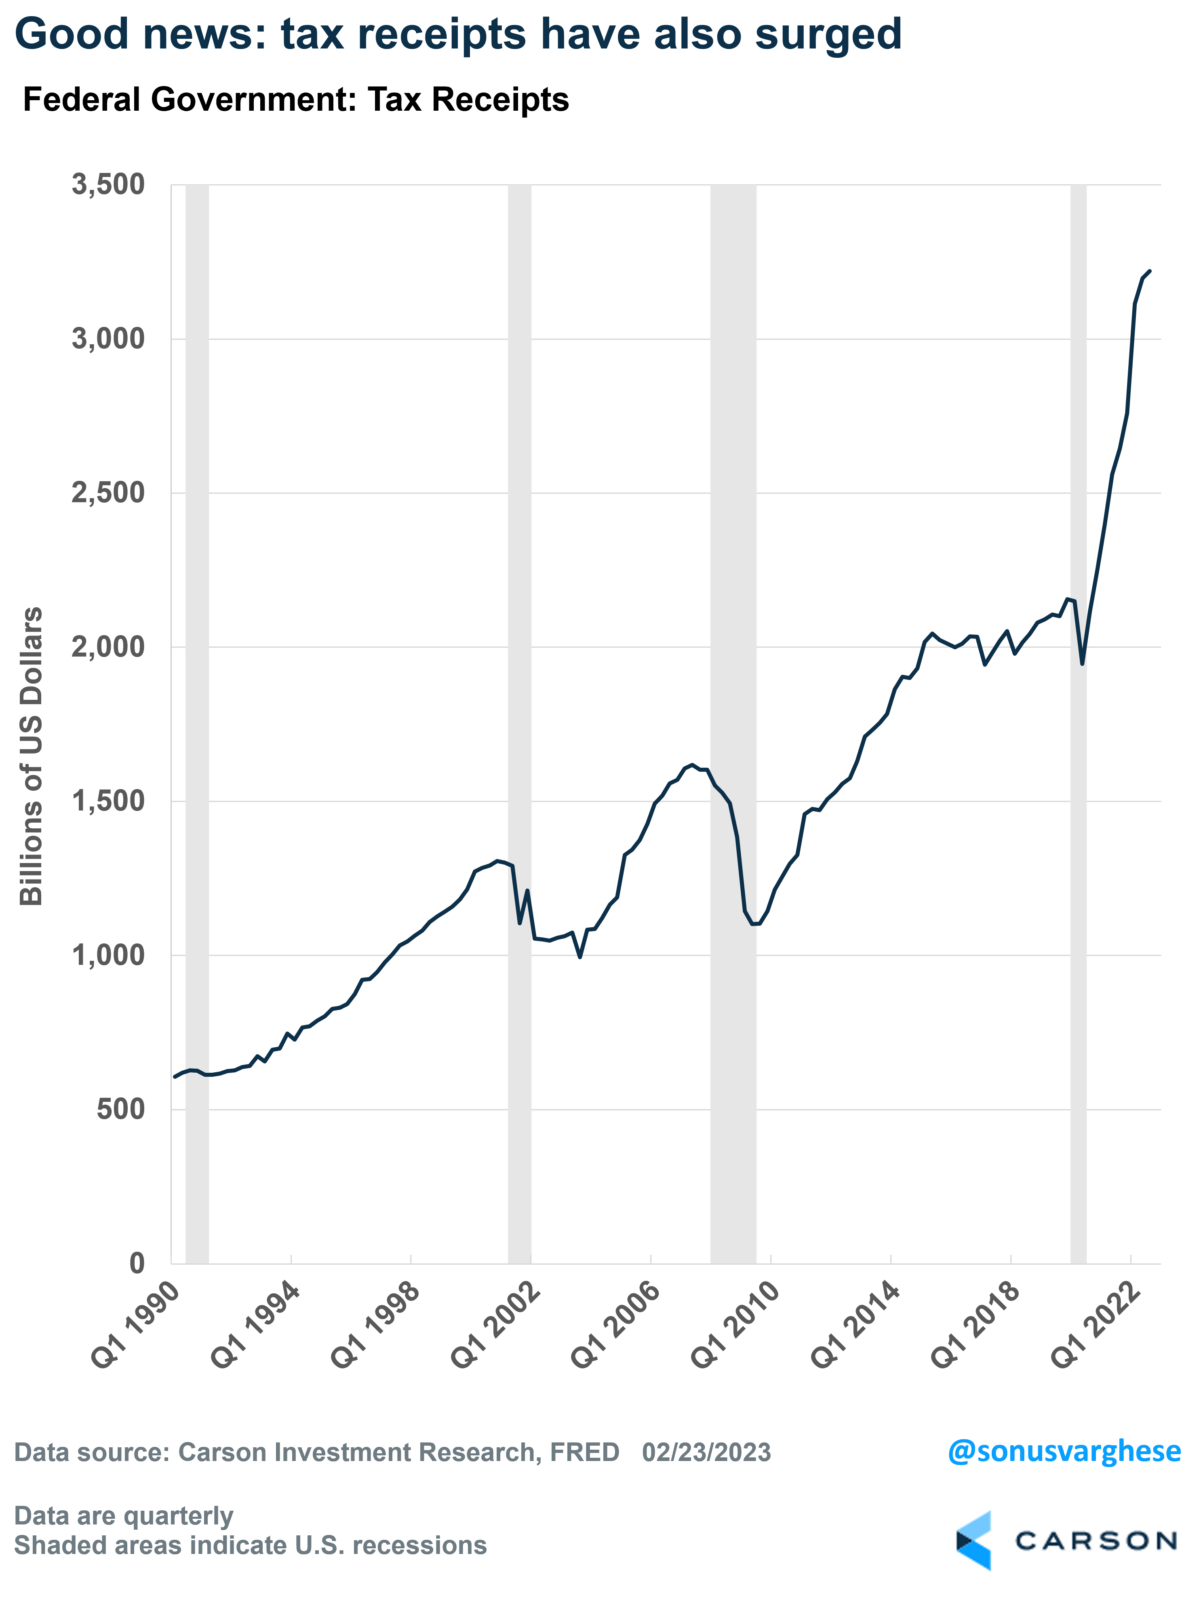
The other side of the story
The good news is that tax receipts have also exploded higher recently. Of course, rising employment helps a lot – there’s a bit of a round-trip here, with fiscal stimulus helping maintain spending and employment, which in turn is holding up tax revenue. Plus, the stock market has moved up a lot in 2020 and 2021, which means capital gains taxes have also increased.
(CLICK HERE FOR THE CHART!)
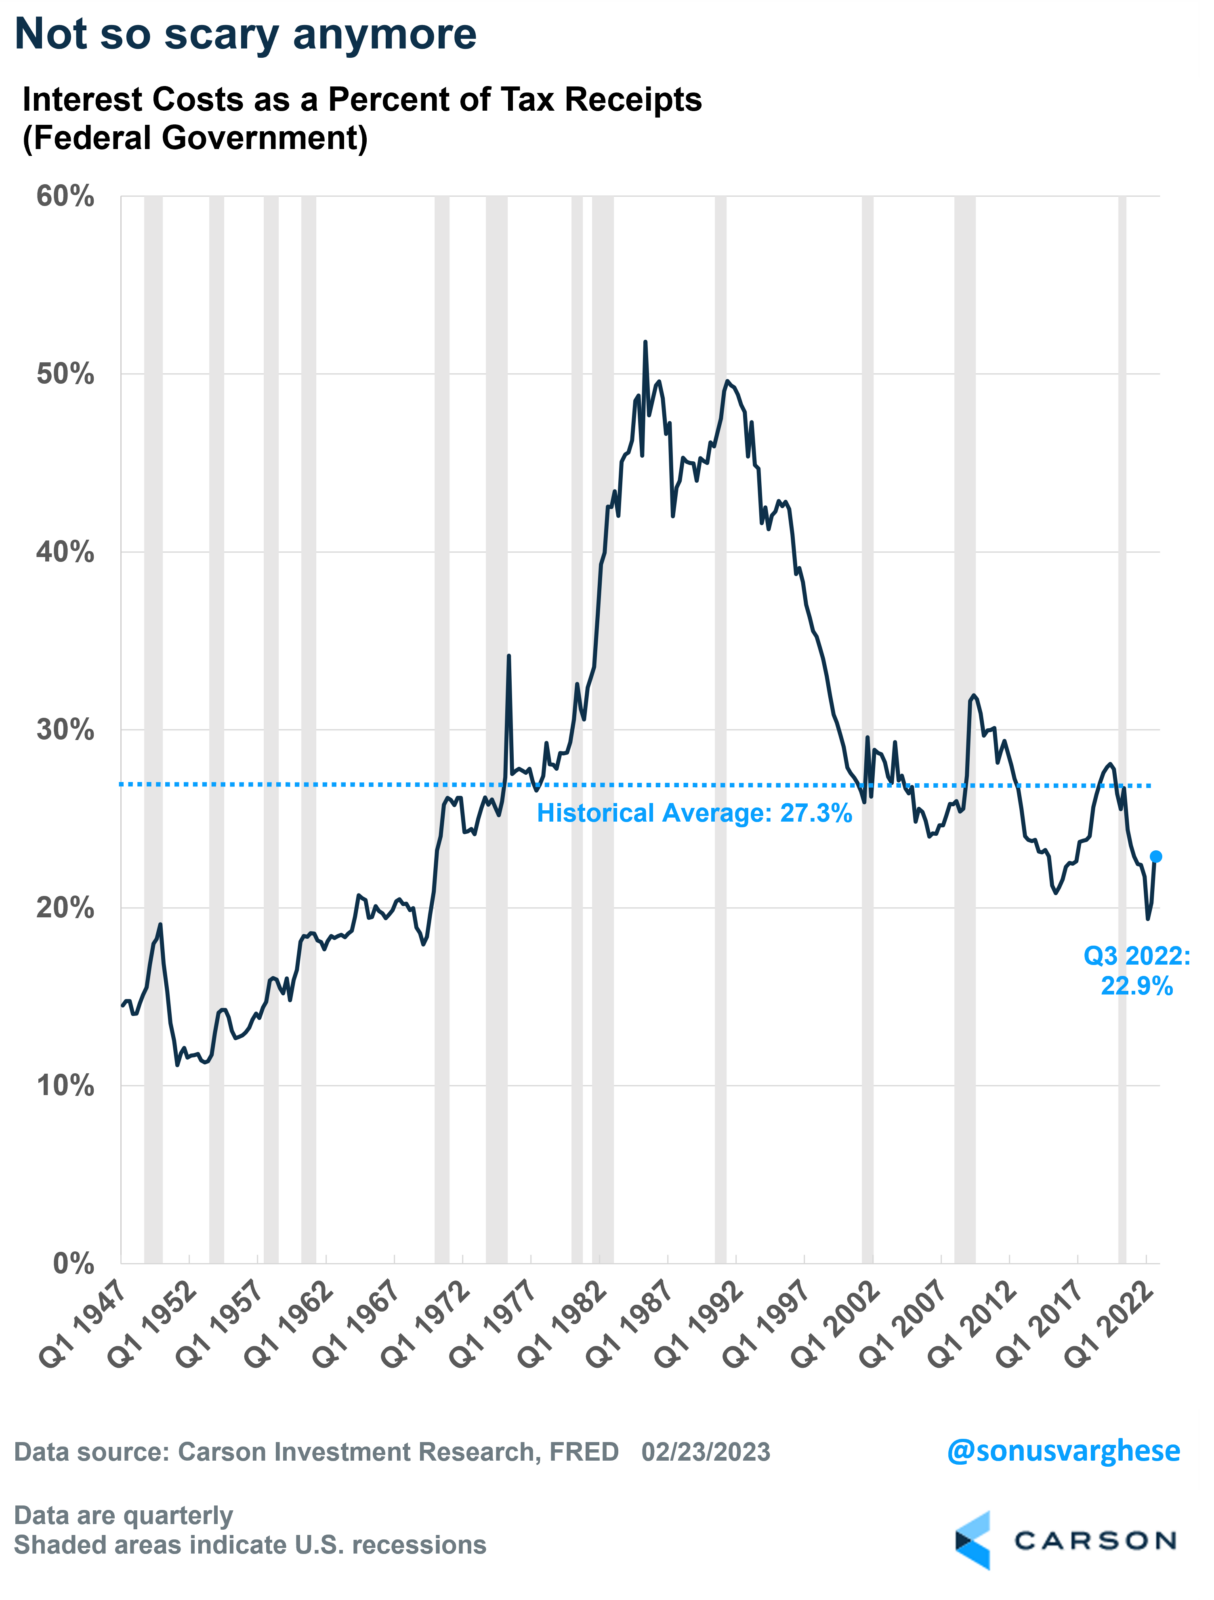
If you look at interest costs as a percent of tax receipts, things don’t look as scary. The ratio has risen recently to about 23%, but that’s well below the historical average of 27% (from 1947 onwards).
(CLICK HERE FOR THE CHART!)
What’s interesting about the chart is that you can see that the ratio surged in the early 1980s. That’s because the Volcker interest rate hikes did two things:
* Raised interest rates
- Sent the economy into a recession, which meant there were less tax receipts as spending and employment fell
Interest costs as a percent of tax receipts hit a peak of 52% in 1985. Usually, the concern when government interest costs rise is that it “crowds out” private investment. Between Q1 1983 and Q2 1985, interest costs as a percent of tax receipts jumped from 43% to 52%. And private nonresidential investment grew 30% during this period.
This framework also helps us think about what could happen going forward.
Looking ahead
Let’s consider the numerator first, i.e., tax costs. It looks like the Federal Reserve is close to the end of its interest rate hikes, assuming we don’t get another upward inflation shock. Now, deficits are projected to remain high over the next decade, around 6% of GDP, but unless we have an economic shock that also prompts a lot more fiscal stimulus, we are unlikely to see the overall level of debt surge higher like it did in 2020.
With respect to the denominator, i.e., tax receipts, it is ultimately dependent on economic growth since tax receipts are a function of that. As long as GDP rises, the debt-to-GDP ratio should remain stable (or fall), and tax receipts will continue to rise. This is why debt-to-GDP fell from 135% in 2022 to 120% in 2020: rather than debt going down, GDP went up. Nominal GDP rose 12.2% in 2021 and 7.3% in 2022.
The key for tax receipts to hold up is for the economy to avoid a recession. And that is our base case right now, that there will be no recession.
So yes, we believe the US debt and interest costs are certainly manageable.
Interest Rate & Recession Fears Suppress Pre-Election Year Bullishness in February
February’s strong start was not able to overcome concerns of additional interest rate hikes, recession or generally tepid corporate earnings and guidance. As of today’s close, all market gains in February have been lost and then some. DJIA is off 2.81%, S&P 500 is down 1.94%, NASDAQ has shed 0.80% and Russell 2000 is 2.26% lower. Like recent Februarys the market did rally ahead of mid-month, but now also appears to be weakening in typical fashion in the back half of the month. Historical trends suggest weakness could persist through the end of the month with just a brief bounce possible later this week.
(CLICK HERE FOR THE CHART!)
Here are the most notable companies (tickers) reporting earnings in this upcoming trading week ahead-
(T.B.A. THIS WEEKEND.)
(CLICK HERE FOR NEXT WEEK'S MOST NOTABLE EARNINGS RELEASES!)
(CLICK HERE FOR NEXT WEEK'S HIGHEST VOLATILITY EARNINGS RELEASES!)
(CLICK HERE FOR MONDAY'S PRE-MARKET NOTABLE EARNINGS RELEASES!)
(T.B.A. THIS WEEKEND.)
(T.B.A. THIS WEEKEND.) (T.B.A. THIS WEEKEND.).
(CLICK HERE FOR THE CHART!)
DISCUSS!
What are you all watching for in this upcoming trading week?
I hope you all have a wonderful weekend and a great trading week ahead r/stocks. 🙂
Leave a Reply