Good Friday evening to all of you here on r/stocks! I hope everyone on this sub made out pretty nicely in the market this week, and are ready for the new holiday-shortened trading week ahead. 🙂
Here is everything you need to know to get you ready for the trading week beginning February 20th, 2023.
Dow closes more than 100 points higher on Friday, but notches third straight week of losses on rate fears: Live updates – (Source)
U.S. stocks were mixed on Friday as stubbornly high inflation and a rebound in rates continued to weigh on investor sentiment.
The Dow Jones Industrial Average rose 129.84 points, or 0.39% to end at 33,826.69. The 30-stock index rallied from lows of the day boosted by shares of Amgen and United Health, which gained 2.69% and 2.41% respectively.
The S&P 500 shed 0.28% to end the day at 4,079.09, and the Nasdaq Composite fell 0.58% to close at 11,787.27. Energy was the biggest laggard. Devon Energy dropped 4.29%, dragging down the S&P 500.
Stocks are mixed on the week. The Dow ended down 0.13% for the week, its third negative week in a row — a first since September. The S&P 500 has shed 0.28% for the week, its second negative week in a row. The Nasdaq rose 0.59% on the week.
Investors continue to worry about how the economy and equities will hold up as the Federal Reserve hikes rates to tame stubbornly high inflation. In a Friday speech, Federal Reserve Governor Michelle Bowman said there’s a long way to go before the central bank reaches its target of 2% inflation.
“We have been in a very contentious tug of war between the equity markets and the Treasury markets,” said Art Hogan, chief market strategist at B. Riley. While Treasurys are signaling that the Fed is going to hold rates higher for longer, equities are not listening and instead looking for a soft landing.
“Equity investors seem to be looking through a couple more rate hikes and looking forward to a pause,” he added.
The moves came after major averages shed more than 1% on Thursday, after the Labor Department said the producer price index — an inflation metric that tracks wholesale prices — rose 0.7% last month. That was more than economists expected.
Next week, investors will continue to watch earnings season for signs of consumer strength or weakness. Home Depot, Walmart and Etsy are scheduled to report results next week.
This past week saw the following moves in the S&P:
(CLICK HERE FOR THE FULL S&P TREE MAP FOR THE PAST WEEK!)
S&P Sectors for this past week:
(CLICK HERE FOR THE S&P SECTORS FOR THE PAST WEEK!)
Major Indices for this past week:
(CLICK HERE FOR THE MAJOR INDICES FOR THE PAST WEEK!)
Major Futures Markets as of Friday's close:
(CLICK HERE FOR THE MAJOR FUTURES INDICES AS OF FRIDAY!)
Economic Calendar for the Week Ahead:
(CLICK HERE FOR THE FULL ECONOMIC CALENDAR FOR THE WEEK AHEAD!)
Percentage Changes for the Major Indices, WTD, MTD, QTD, YTD as of Friday's close:
(CLICK HERE FOR THE CHART!)
S&P Sectors for the Past Week:
(CLICK HERE FOR THE CHART!)
Major Indices Pullback/Correction Levels as of Friday's close:
(CLICK HERE FOR THE CHART!)
Major Indices Rally Levels as of Friday's close:
(CLICK HERE FOR THE CHART!)
Most Anticipated Earnings Releases for this week:
(CLICK HERE FOR THE CHART!)
Here are the upcoming IPO's for this week:
(CLICK HERE FOR THE CHART!)
Friday's Stock Analyst Upgrades & Downgrades:
(CLICK HERE FOR THE CHART LINK #1!)
(CLICK HERE FOR THE CHART LINK #2!)
(CLICK HERE FOR THE CHART LINK #3!)
The Valentine’s Day Indicator Sees Green In 2023
First things first, this is a three-day weekend for many of us and I hope everyone enjoys the long President’s Day weekend. And if you need to buy a mattress, this is your Super Bowl weekend, good luck out there. Speaking of the Super Bowl, this is our yearly reminder that someone should run for President, and their whole platform should be to make sure that the Super Bowl is always over President’s Day weekend. Who wouldn’t want the day after the big game off? I swear they’d win …. But I digress.
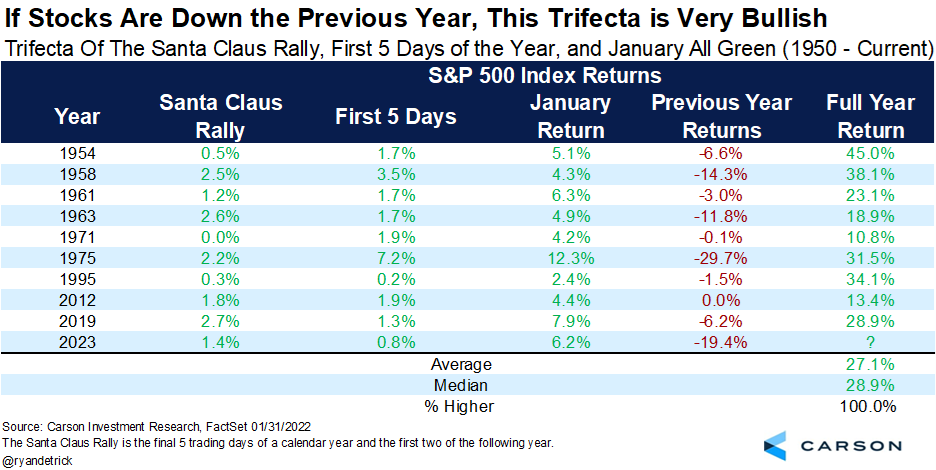
We’ve noted many times this year some of the rare yet bullish developments taking place for stocks that should continue to lead to strong performance in 2023. For example, we discussed why the strong January, amid a negative year the year before, could be a very good thing in The Trifecta of Bullish. Here’s one of the tables from that blog. Higher nine for nine and up 27% for the year would make many bulls smile.
(CLICK HERE FOR THE CHART!)
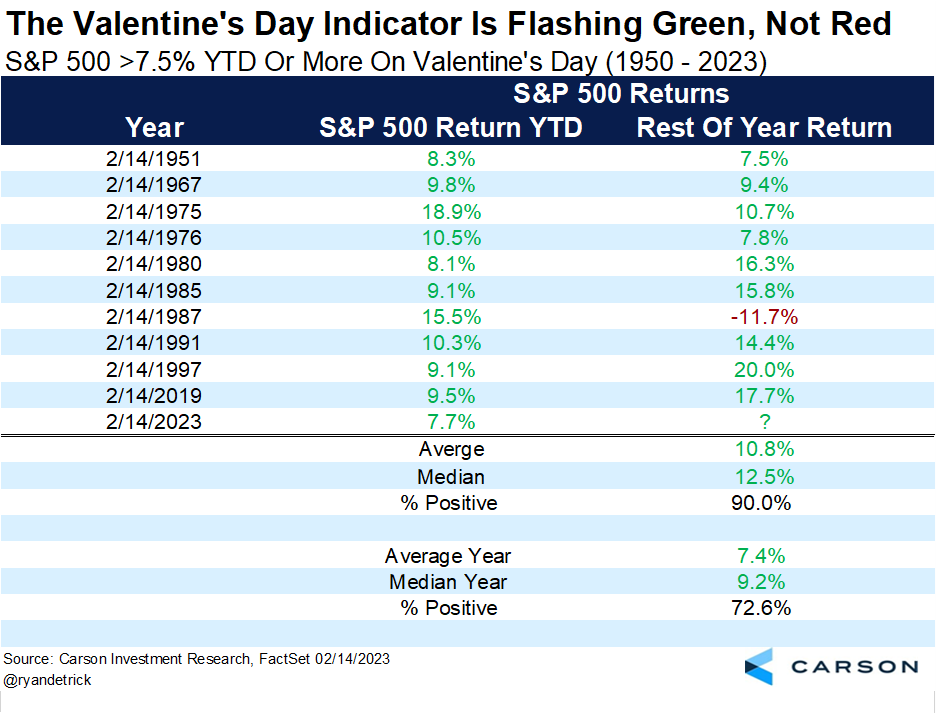
Let’s take another look at the strong start to 2023, but this time wrap in Valentine’s Day. I hope everyone had a nice Valentine’s Day earlier this week. Mine was a winner, as my wife got me a Reese’s Take 5 candy bar, my favorite for sure. Do you know who also had a nice Valentine’s Day? The bulls. I know, I know, Valentine’s Day is known for red; well, the Valentine’s Day Indicator is flashing green.
2023 was the 11th-best start to a year ever for the S&P 500 as of Valentine’s Day, up a very impressive 7.7%. What happened next, looking at the best ten starts to a year? Nine out of 10 times the rest of the year was green, with an average return of nearly 11% and a median return of 12.5% – both well above the average returns. Momentum can be a wonderful thing for investors, and the Valentine’s Day Indicator does little to change that.
(CLICK HERE FOR THE CHART!)
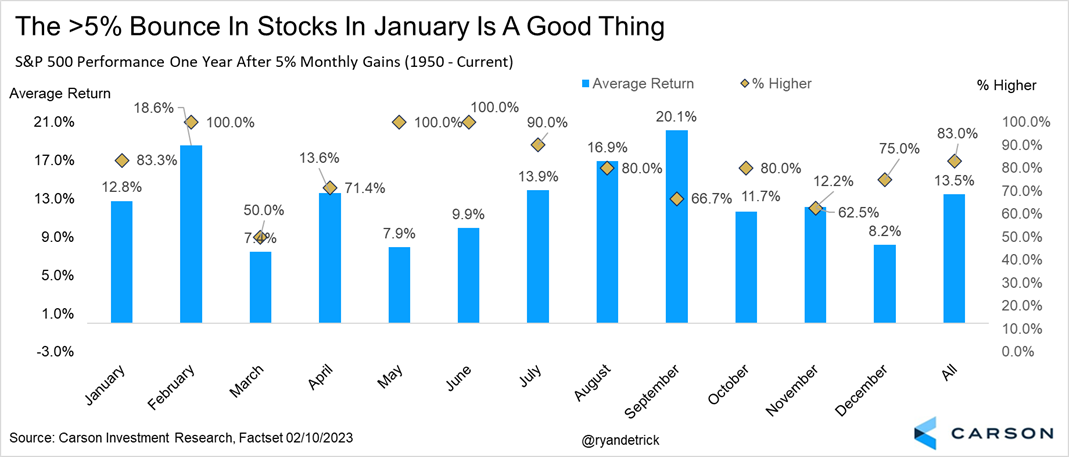
Speaking of momentum, here’s an interesting study I did when stocks gained more than 5% during a month (like what happened in January). A year later? Stocks are up 13.5% on average and higher 83% of the time, way better than average. I also broke it up by which month the big gains took place. When January gained more than 5%, the next twelve months are up 12.8% on average and higher 83.3% of the time. Maybe we should be rooting for a 5% gain in May or June, as stocks have never been lower a year later. Or maybe in September, when they gained an incredible 20% on average a year later?
(CLICK HERE FOR THE CHART!)
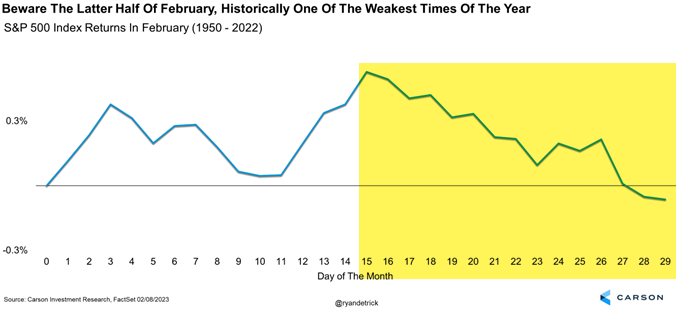
I will leave you with this. February historically isn’t a very strong month for stocks, and it is the second half of February when trouble tends to arrive. We are still quite optimistic about how well stocks could do the rest of 2023, but it won’t be a straight line. Just be aware that the next three or four weeks historically aren’t very strong, and some well-deserved seasonal weakness could be perfectly normal and healthy.
(CLICK HERE FOR THE CHART!)
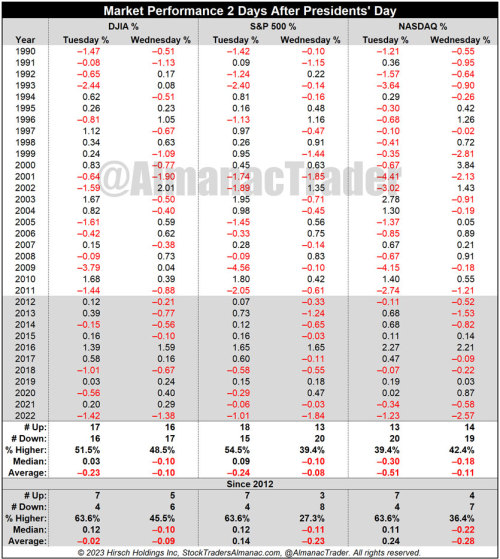
# Up 7 of Last 11 After Presidents’ Day But Still Weak Long Term
DJIA, S&P 500 and NASDAQ are all up 7 of the last 11 years on the day after the Presidents’ Day market holiday with average changes ranging from -0.12% for DJIA to 0.24% for NASDAQ. In our February 2023 Strategy Calendar for members shows conflicting indications for this Tuesday, February 21, the day after Presidents’ Day. Over the most recent 21-year history this 15th trading of February has been down 61.9% of the time for S&P 500 with average loss of -0.29% earning the day our “Angry Bear” icon.
Earlier this week noted the improving trend of market performance ahead of Presidents’ Day weekend. As you can see in the table here the days after has improved the past 11 years but the Wednesday after has not enjoyed the same turnaround and both days still display a fair amount of red. Since 1990, Tuesday after Presidents’ Day has been strongest for the S&P 500 with 18 gains and 15 losses for median gain of 0.09% but with an average loss of –0.24%. DJIA also has more gains than losses on the Tuesday after, but NASDAQ is a net loser down 20 of 33 years with an average loss of –0.51% and a median loss of –0.30%.
Wednesday is all red for all three major averages. NASDAQ and S&P 500 have more losses, but DJIA is a loser as well. On the Wednesday after the Presidents’ Day holiday DJIA is down 17 of 33 with an average loss of –0.10% and a median decline of –0.10%. S&P 500 is down 20 of 33, average –0.08%, median –0.10% and NASDAQ is down 19 of 33, average –0.11%, median –0.18%.
Big losses two days just before and after President’s Day 2022 fueled by the escalation of belligerent rhetoric and military buildups right before Russia invaded Ukraine have worsened the record. Prior to the invasion the market was already dropping in the face of hot inflation and expectations of coming aggressive Fed rate hikes.
(CLICK HERE FOR THE CHART!)
American Consumers: Have Money, Will Spend
“American Consumers: Have money, will spend“
That, in a nutshell, is the story of the economy right now.
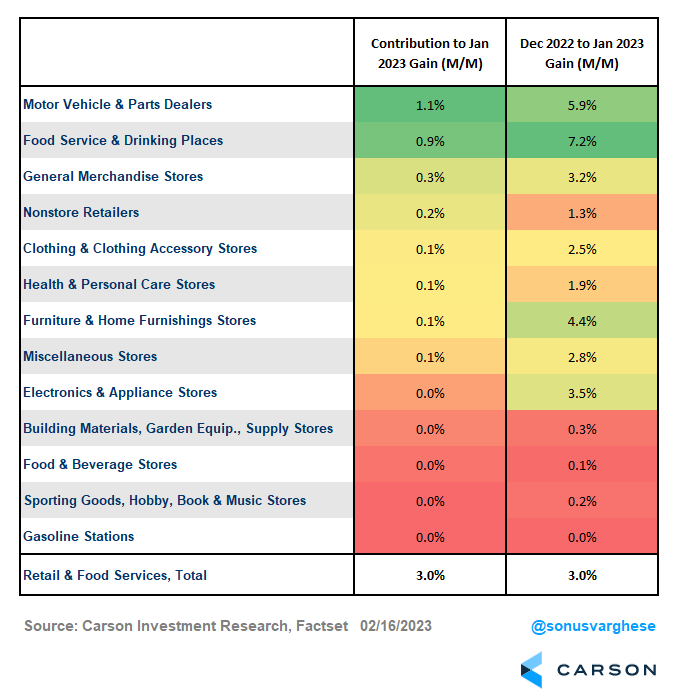
Retail sales and food services surged 3% in January, making a mockery of expectations for a 1.7% gain. This is the largest monthly increase since March 2021, but that came on the back of stimulus checks. So excluding the 2020/2021 recovery period (when we saw large drops and gains), you have to go back to October 2001 to find a month with larger gains. And even that was a rebound after a depressed September.
Such a large number should immediately get your antennae up, and there certainly are seasonality issues. For three years, we’ve seen retail sales drop in December only to surge in January.
But don’t miss the big picture: consumption is running strong
Vehicle sales were the big driver, accounting for over a third of the overall gain. But there was broad strength everywhere, including general merchandise stores, e-commerce, clothing stores, and even furnishings (despite the slowdown in housing activity).
Spending at restaurants and bars rose by a whopping 7.2%, and it wasn’t because of prices (up 0.6% last month).
(CLICK HERE FOR THE CHART!)
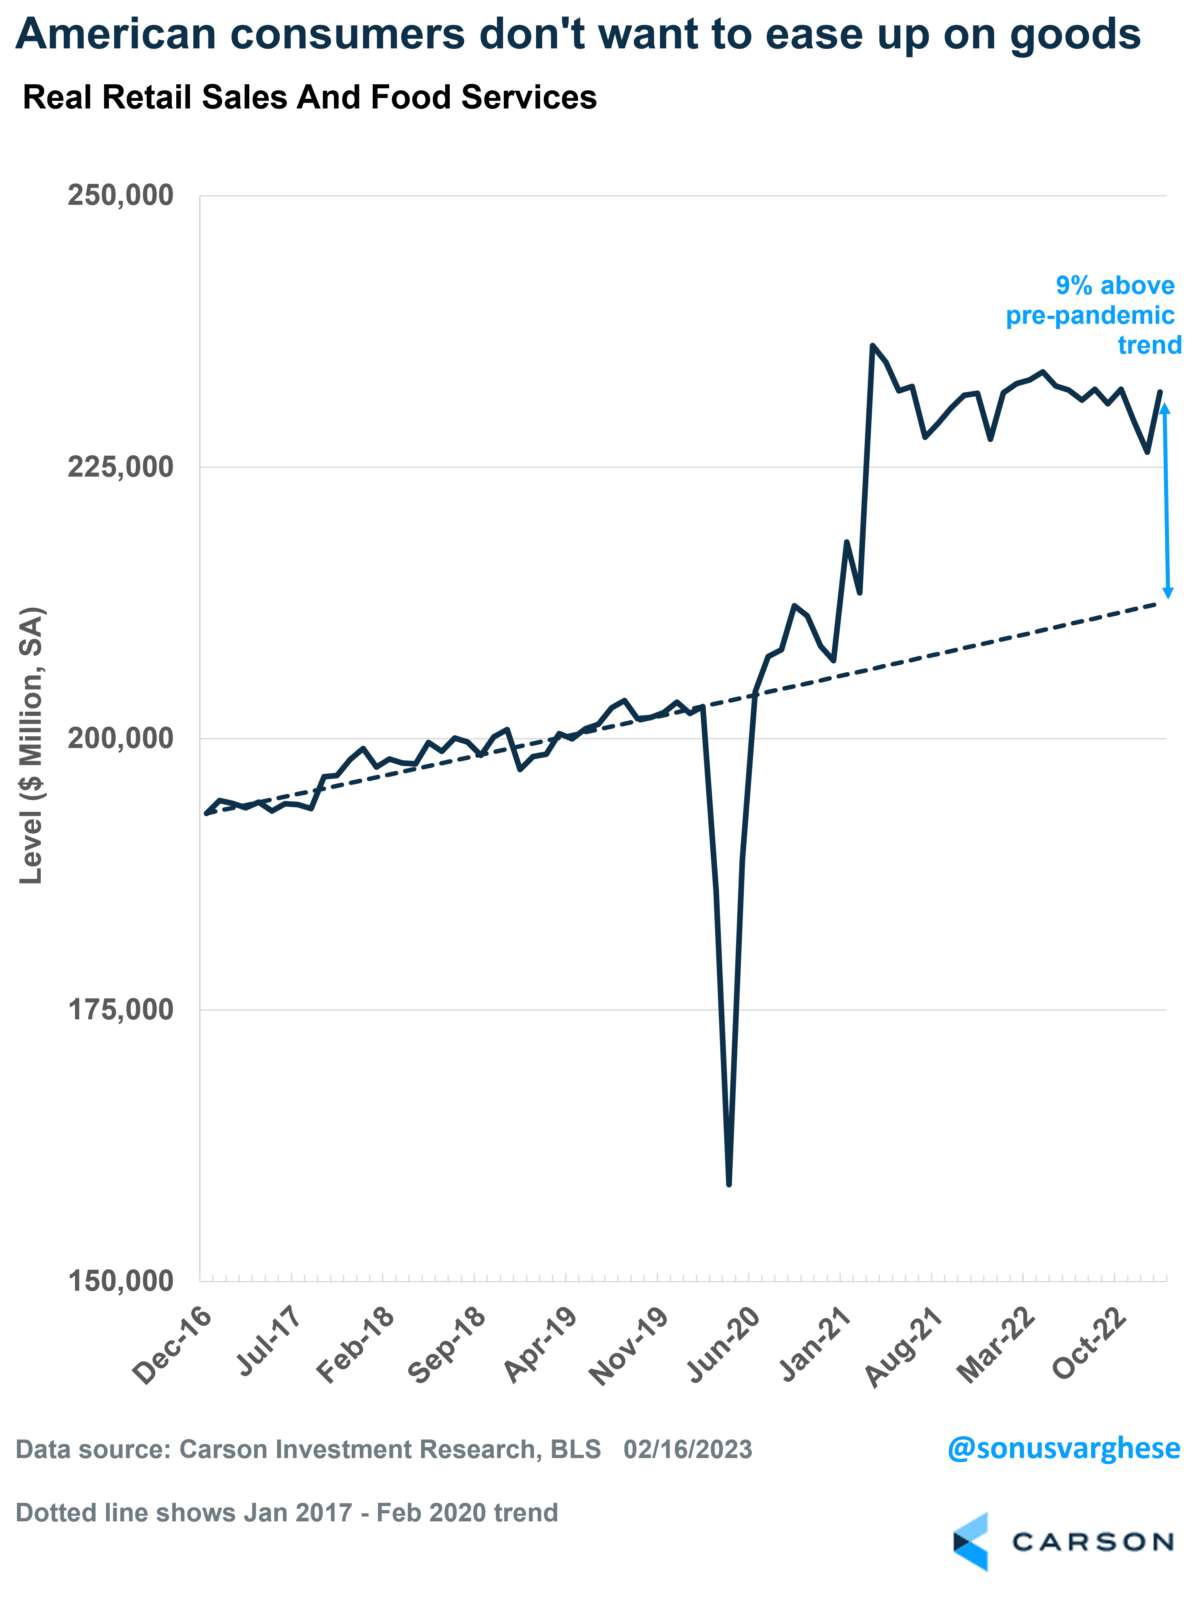
“Real” retail sales and food services, i.e., after adjusting for inflation, rose 2.4% in January. It’s currently running 9% above the pre-pandemic trend. Make all the seasonality-related adjustments you want—no denying that consumption is strong. The only surprise really is how strong goods consumption is running, even as we get further away from the pandemic. The expectation was that consumption patterns would normalize by now, and goods spending would head back towards trend.
(CLICK HERE FOR THE CHART!)
Consumption is strong because real incomes are rising
It really doesn’t get much simpler than that.
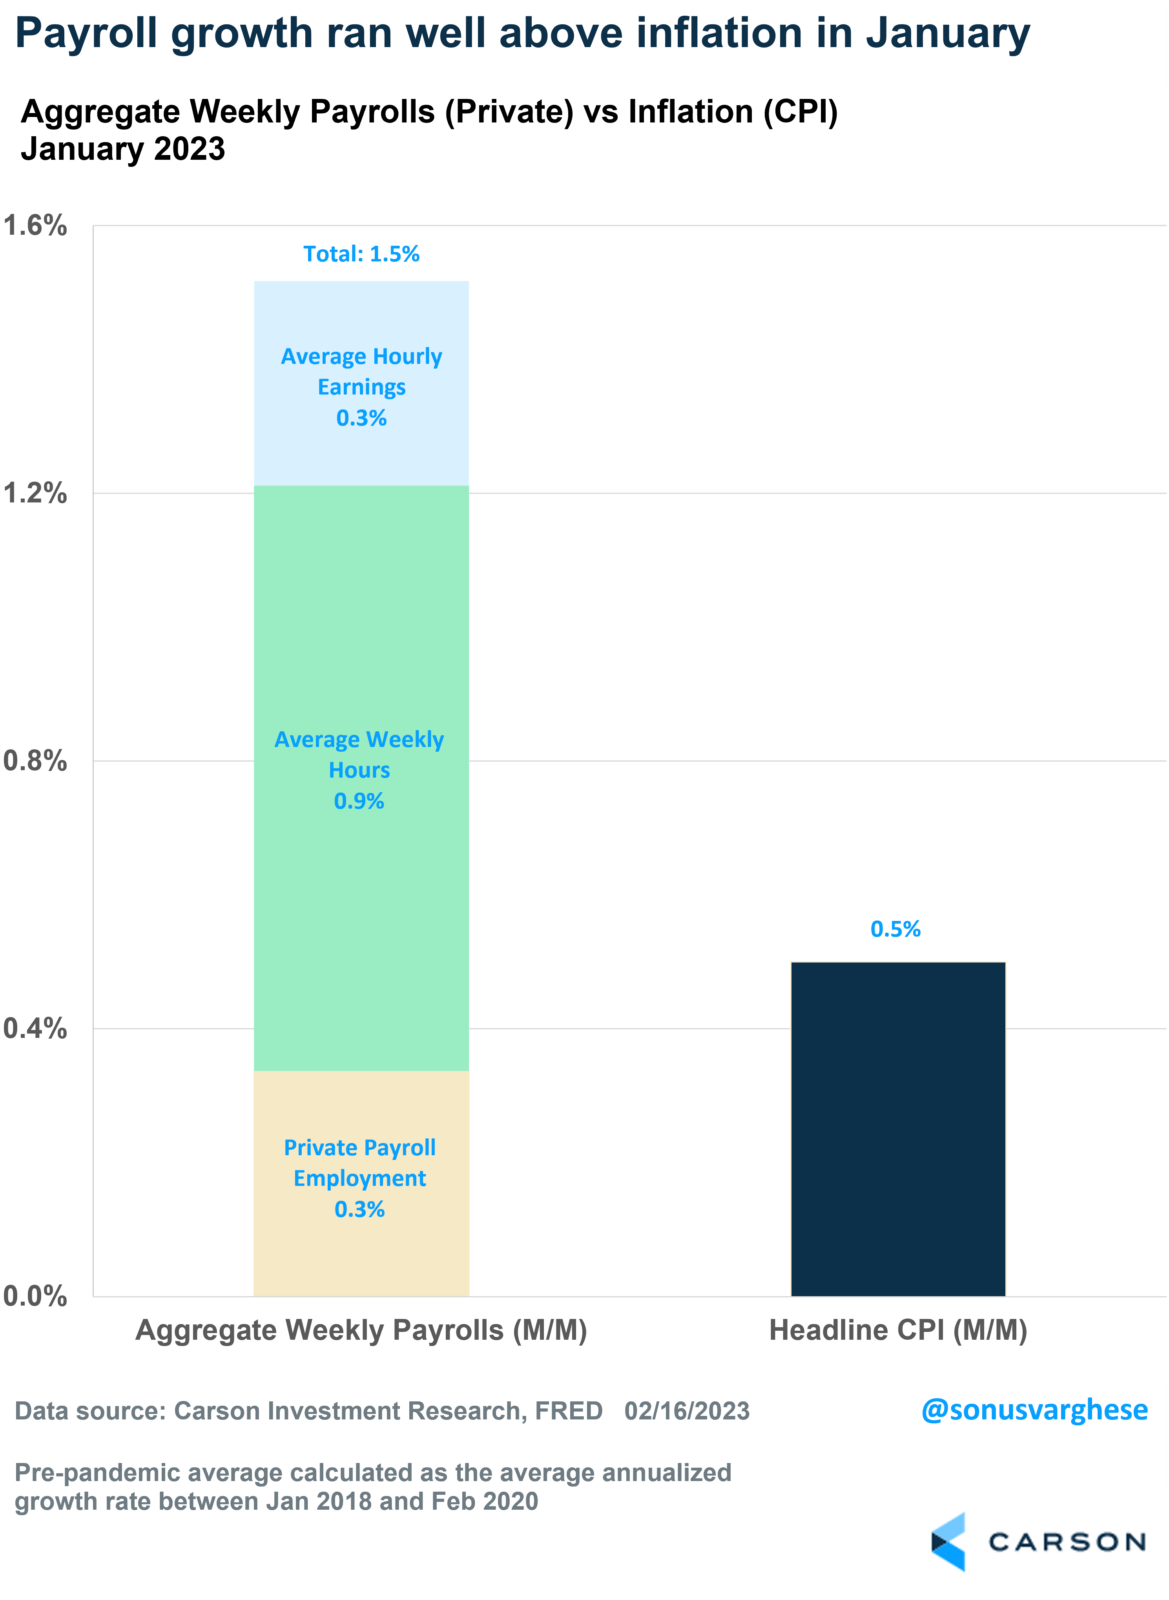
January is a great example. Aggregate weekly payrolls, which should give you a sense of income earned by private workers across the economy, rose 1.5% in January. This was on the back of:
Rising employment (remember the massive jobs report?)
* More hours worked
* Strong wage growthMeanwhile, inflation was up “only” 0.5%.
(CLICK HERE FOR THE CHART!)
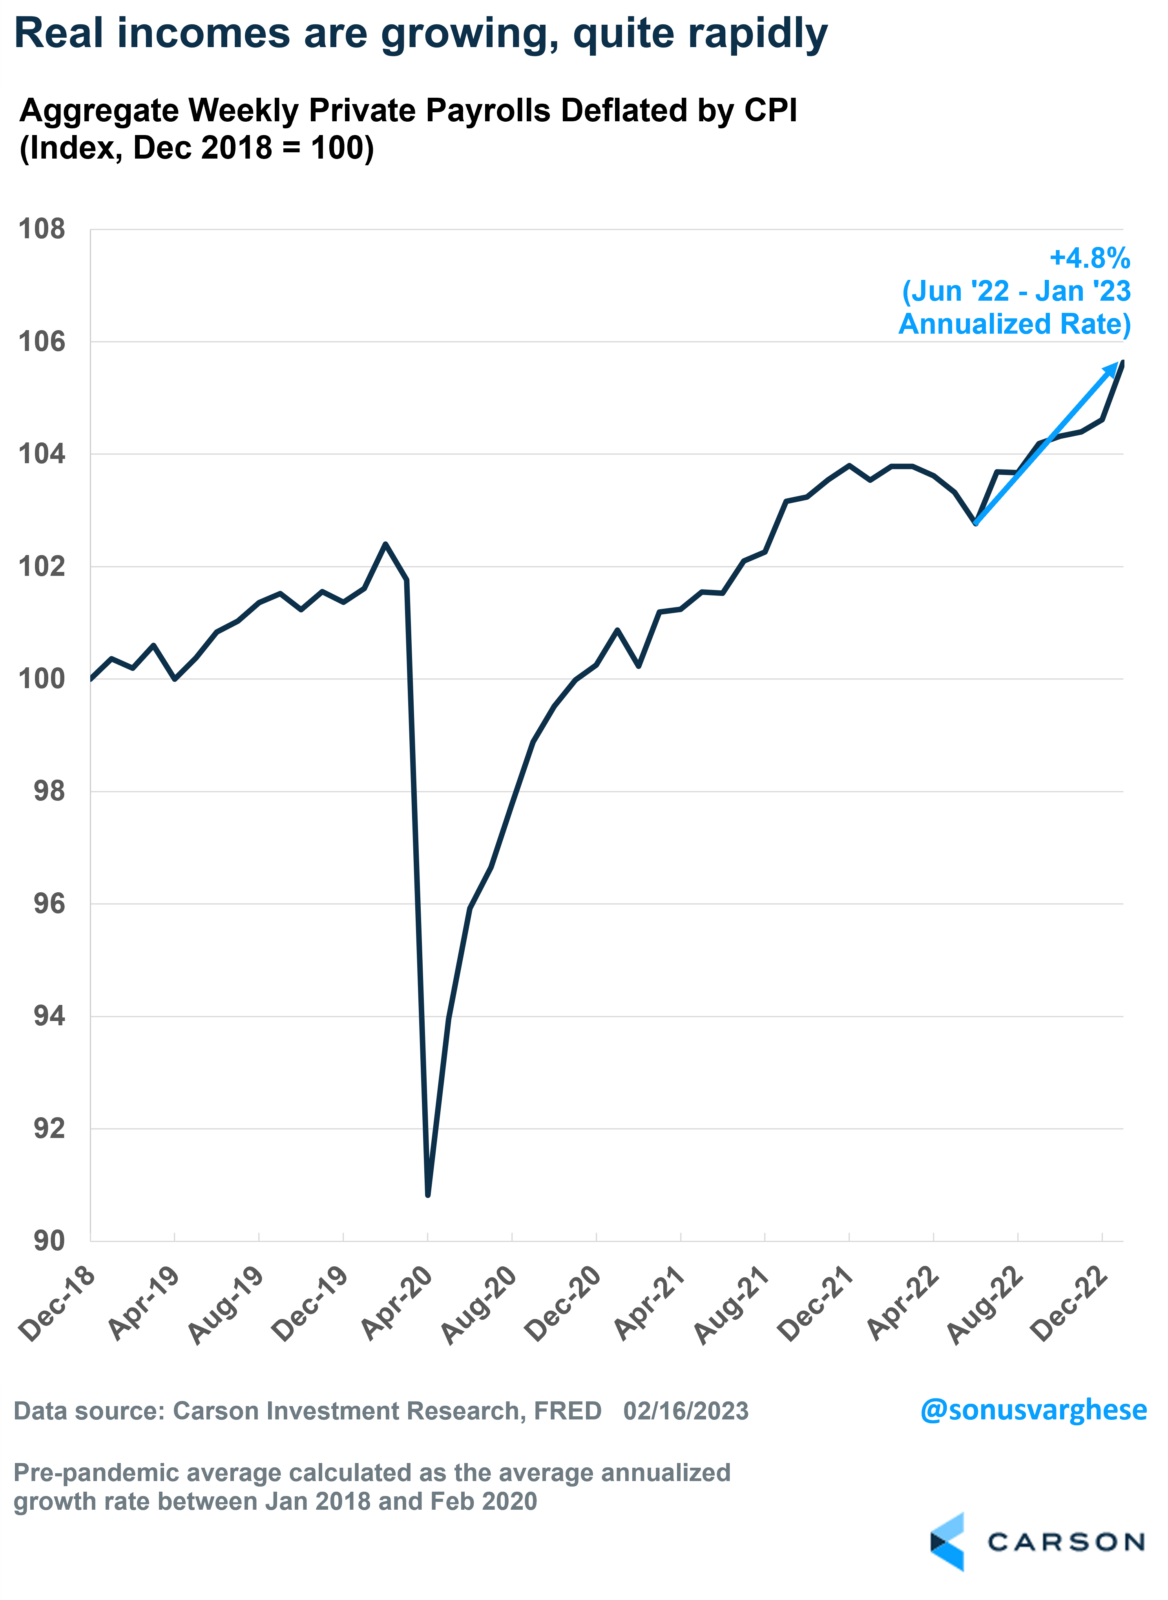
After adjusting for prices, aggregate payrolls have now been rising since last June at an annualized pace of almost 5%. For perspective, this measure of aggregate income ran at an annual pace of just over 2% before the pandemic.
The current pace is hot, to put it mildly, so don’t be surprised if we get a pullback. But if employment continues to rise, wage growth remains strong, and inflation doesn’t surge, real incomes should continue trending higher. And that’s a tailwind for consumption and the economy.
(CLICK HERE FOR THE CHART!)
Of course, the other side of solid consumption is that many of the categories where we see strong consumer spending are seeing upward price pressures. I wrote about this after the January inflation report was released – the fact that inflation is running hot in several service sectors and core goods like apparel and furnishings is another indication that demand is strong, especially in those areas.
Good news is good news, finally
Hot inflation in the service sector is precisely what the Federal Reserve is worried about. So, it isn’t a surprise that markets have repriced their expectations for monetary policy, now taking the Fed at their word that they’ll get to the 5.0-5.25% range for the federal funds rate. And stay there for longer.
That repricing is not great for bonds, but unlike last year, the good news is that stocks have held up quite strong in the face of that. This is positive in that good news about the economy is good news for stocks.
Bulls Step Back
The S&P 500 hasn't moved decisively in any direction over the past week, and as a result, sentiment saw little change. 34.1% of respondents to the weekly AAII sentiment survey reported as bullish this week, down from a high of 37.5% last week.
(CLICK HERE FOR THE CHART!)
Bearish sentiment took from those bullish losses as the reading rose up to 28.8% from 25%. Even though that is a higher reading, it is still the only other reading below 30% since last March.
(CLICK HERE FOR THE CHART!)
Additionally, the pickup in bearish sentiment was not enough to make bears outnumber bulls. As such, the bull-bear spread saw its first back-to-back positive readings since November 2021.
(CLICK HERE FOR THE CHART!)
Although over a third of respondents reported as bullish, this week's predominant sentiment level was neutral. 37.1% reported as such this week. That reading has now been above its historical average of 31.4% for seven straight weeks; the longest streak since January 2021.
(CLICK HERE FOR THE CHART!)
Other sentiment surveys have likewise taken more optimistic tones lately despite a modest pullback in bullish sentiment this week. Factoring in the Investors Intelligence and NAAIM sentiment readings, our sentiment composite remains positive but is off from its short-term peak last week.
(CLICK HERE FOR THE CHART!)
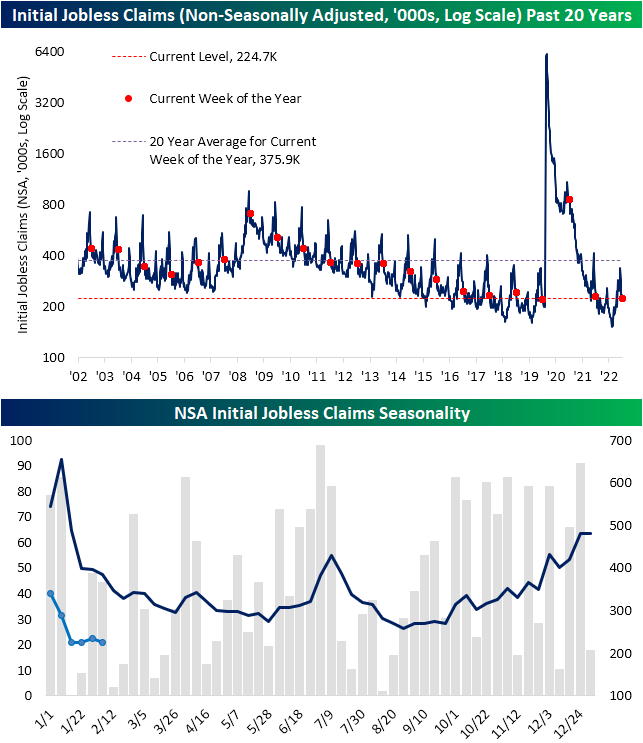
Claims Still Below 200K
Jobless claims continue to impress in the new year. For the fifth week in a row, seasonally adjusted initial claims have come in with a sub-200K reading. That is the longest streak since a 10 week long stretch ending in April of last year. Although claims have remained at a healthy level, there hasn't been much in the way of improvement over the last few weeks with claims yet to move below the 183K low at the end of January.
(CLICK HERE FOR THE CHART!)
On a non-seasonally adjusted basis, the first few months of the year tends to see a sharp unwind in claims, albeit with some moderation during the current week of the year which is being observed currently with fairly flat readings in claims over the past few weeks. At current levels, this year's reading was roughly in line with the comparable week of the past several years with the exception of the much more elevated reading in 2021.
(CLICK HERE FOR THE CHART!)
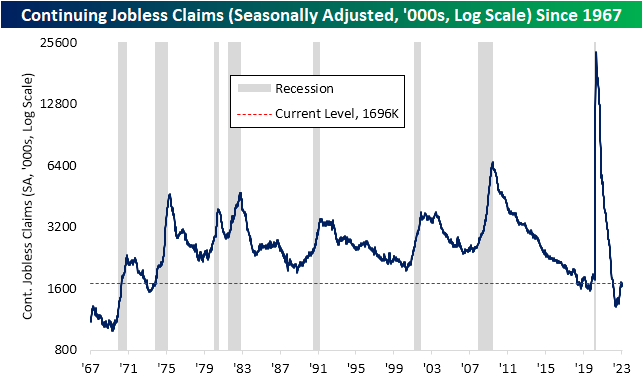
While not to say the reading is at unhealthy levels, continuing claims have not been as strong as initial claims. Claims have risen in each of the past two weeks, totaling 1.696 million in the most recent print. That is the highest level since the week of December 24th. Overall, both initial and continuing claims continue to show healthy readings without much in the way of rapid improvement or deterioration.
(CLICK HERE FOR THE CHART!)
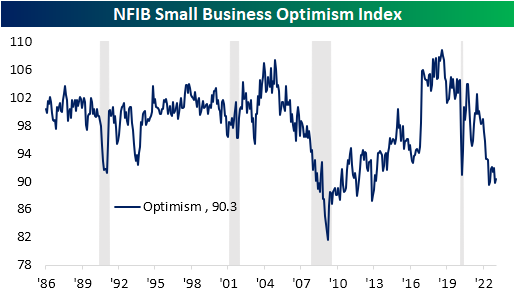
NFIB Nuances
This morning's release of the NFIB's survey of small business sentiment showed only a modest rebound. Whereas the index was expected to rise from 89.8 up to 91, the index only rose to 90.3. Albeit higher sequentially and off the lows from last fall, the January reading also remains below the worst levels from the onset of COVID.
(CLICK HERE FOR THE CHART!)
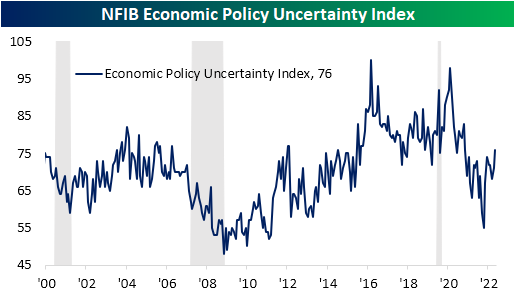
In addition to optimism remaining weak, the most recent month also saw a surge in economic policy uncertainty. Rising 5 points month over month to 76, that index is at the highest level since July 2021 and saw its biggest one month jump since last July.
(CLICK HERE FOR THE CHART!)
Looking across the individual components of the report, breadth was mixed with six of the ten inputs into the headline optimism number moving higher while the other four fell. Multiple categories—in addition to the headline index—are in the bottom decile of their historical ranges. As we discussed in today's Morning Lineup, while in aggregate some aspects of the report remain weak, there is some nuance. In general, this month's report saw improvement in categories measuring realized changes (i.e. actual earnings changes, actual sales changes, actual employment changes, etc.) while expectations were much worse (i.e. plans to make capital outlays, plans to increase inventories, etc.). In other words, small businesses appear to have pessimistic outlooks contrary to reporting actual improvements in their businesses.
(CLICK HERE FOR THE CHART!)
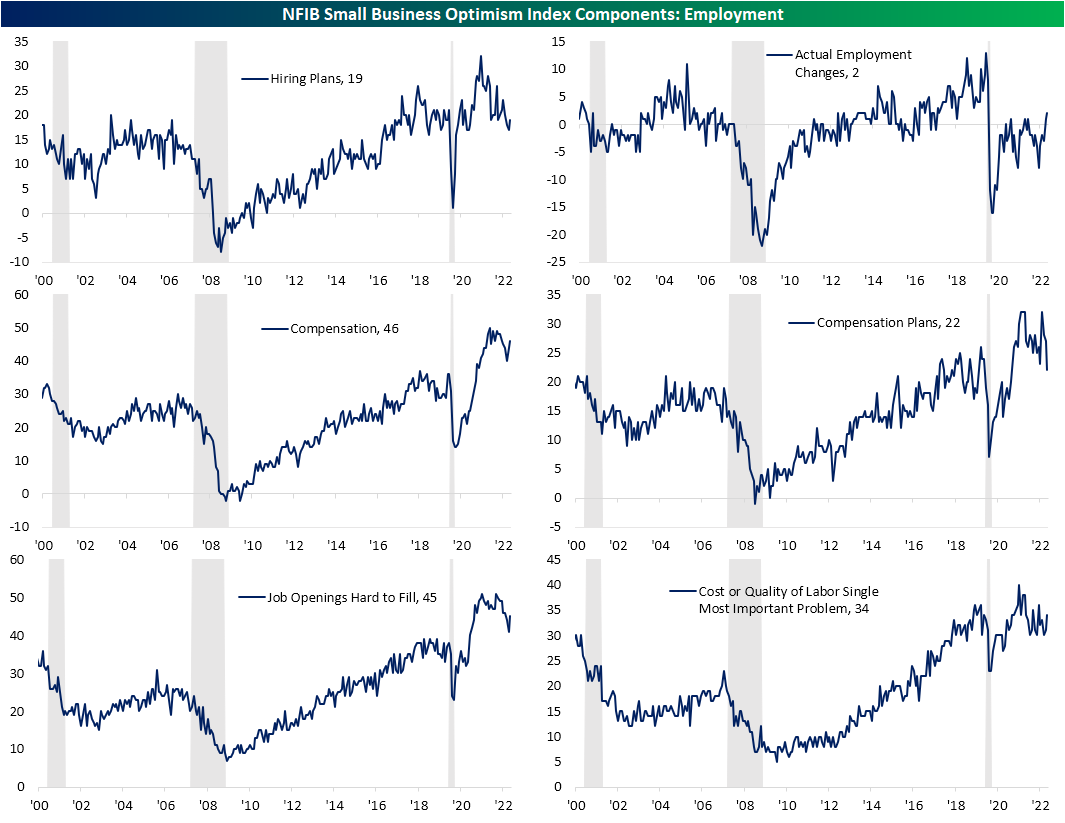
The employment situation showcases that divergence between actual changes and plans. Hiring plans remain at the low end of the pandemic range even after a slight rebound versus the December reading. Meanwhile, compensation plans have plummeted to a new low and the weakest level since April 2021. That was in spite of actual employment changes showing net hirings at the highest level since March 2020 with a coincident uptick in compensation to the highest level in six months.
(CLICK HERE FOR THE CHART!)
Albeit on net more firms are seeing declines rather than increases, this month also saw an improvement in actual sales and earnings. Part of that change is likely thanks to alleviation in inflation as the higher prices index hit a new post-high low of 42. In turn, the percentage of respondents reporting now as a good time to expand has modestly recovered. With that said, sales expectations continued to reverse lower after peaking two months ago.
(CLICK HERE FOR THE CHART!)
As for expenditure indices, again the dichotomy of plans and actual changes is apparent. While plans experienced a 13th percentile month over month decline to the low end of its pandemic range, reported capital expenditures have surged with a top decile month over month reading. In fact, that sharp rise during the month of January resulted in the joint highest reading of the post pandemic period (March and May 2021 saw identical readings).
Meanwhile, plans to increase inventories are rapidly declining. The index for inventory accumulation has now reached the lowest level since 2009. However, even though inventories are rapidly declining, businesses on net report satisfaction with current inventory levels. Following the very high readings in inventory satisfaction earlier in the pandemic (meaning on net a higher percentage of respondents reported inventories were too low), the huge drop in inventory accumulation would indicate some supply/demand mismatches are working themselves out; likely in part thanks to weakening sales.
(CLICK HERE FOR THE CHART!)
Turning back to capital expenditures, the NFIB also surveys on what these small businesses are spending their money on. January saw a broad uptick across categories with the exception of furniture or fixtures.
(CLICK HERE FOR THE CHART!)
Here are the most notable companies reporting earnings in this upcoming trading week ahead-
- (T.B.A. THIS WEEKEND.)
(CLICK HERE FOR NEXT WEEK'S MOST NOTABLE EARNINGS RELEASES!)
(CLICK HERE FOR NEXT WEEK'S HIGHEST VOLATILITY EARNINGS RELEASES!)
(CLICK HERE FOR TUESDAY'S PRE-MARKET NOTABLE EARNINGS RELEASES!)
(T.B.A. THIS WEEKEND.)
(T.B.A. THIS WEEKEND.) (T.B.A. THIS WEEKEND.).
(CLICK HERE FOR THE CHART!)
DISCUSS!
What are you all watching for in this upcoming trading week?
I hope you all have a wonderful long 3-day holiday weekend and a great trading week ahead r/stocks. 🙂
Leave a Reply