Good Friday evening to all of you here on r/stocks! I hope everyone on this sub made out pretty nicely in the market this week, and are ready for the new trading week ahead. 🙂
Here is everything you need to know to get you ready for the trading week beginning February 13th, 2023.
Dow closes nearly 170 points higher, S&P 500 and Nasdaq post worst week since December: Live updates – (Source)
The S&P 500 eked out a narrow gain in Friday’s session but still had the worst week in nearly two months.
The broad index was up just 0.2% to end the session at 4,090.46. The Nasdaq Composite slipped 0.61% to close at 11,718.12. The Dow Jones Industrial Average advanced 169.39 points, or 0.5%, to end at 33,869.27.
Despite the Dow’s Friday gain, it still ended the week down 0.17%. The S&P 500 and Nasdaq Composite lost 1.11% and 2.41%, respectively, in what was their worst week since December.
Investors digested the most recent interest rate hike, economic data and recent commentary from Federal Reserve speakers, said Shana Sissel, founder of Banríon Capital Management. That caused intraday moves, she said, as investors changed positions while predicting how the central bank will act on interest rates going forward.
“There’s some mixed signals here, which I think is why volatility is up,” Sissel said. “There’s not really a consensus coming out with leading indicators that give you a lot of confidence of what’s coming next. And the markets hate that.”
Ride-hailing platform Lyft tanked more than 36% after a disappointing fiscal fourth-quarter report. Expedia also saw its shares fall by more than 8% after its earnings and revenue fell below analysts’ expectations.
Those are the latest reports in what has been considered an underwhelming quarter by Wall Street. With nearly 70% S&P 500 companies reporting, around 70% of those companies beat analyst expectations for the quarter. That’s a smaller share of companies surpassing expectations than the three-year historical average of 79%, according to The Earnings Scout.
This past week saw the following moves in the S&P:
(CLICK HERE FOR THE FULL S&P TREE MAP FOR THE PAST WEEK!)
S&P Sectors for this past week:
(CLICK HERE FOR THE S&P SECTORS FOR THE PAST WEEK!)
Major Indices for this past week:
(CLICK HERE FOR THE MAJOR INDICES FOR THE PAST WEEK!)
Major Futures Markets as of Friday's close:
(CLICK HERE FOR THE MAJOR FUTURES INDICES AS OF FRIDAY!)
Economic Calendar for the Week Ahead:
(CLICK HERE FOR THE FULL ECONOMIC CALENDAR FOR THE WEEK AHEAD!)
Percentage Changes for the Major Indices, WTD, MTD, QTD, YTD as of Friday's close:
(CLICK HERE FOR THE CHART!)
S&P Sectors for the Past Week:
(CLICK HERE FOR THE CHART!)
Major Indices Pullback/Correction Levels as of Friday's close:
(CLICK HERE FOR THE CHART!)
Major Indices Rally Levels as of Friday's close:
(CLICK HERE FOR THE CHART!)
Most Anticipated Earnings Releases for this week:
(CLICK HERE FOR THE CHART!)
Here are the upcoming IPO's for this week:
(CLICK HERE FOR THE CHART!)
Friday's Stock Analyst Upgrades & Downgrades:
(CLICK HERE FOR THE CHART LINK #1!)
(CLICK HERE FOR THE CHART LINK #2!)
(CLICK HERE FOR THE CHART LINK #3!)
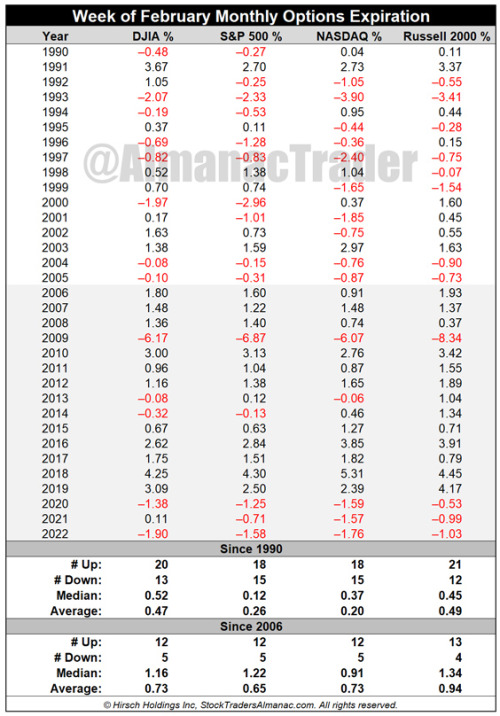
February Monthly Options Expiration Week: DJIA, S&P 500 & NASDAQ Up 12 of Last 17
February’s monthly option expiration week has had a bullish tilt over the past 33 years. Weekly average gains fall in a range of 0.20% from NASDAQ to 0.49% by Russell 2000. Based upon average performance and the number of positive weeks, Russell 2000 has the best track record. Since 2006, February’s monthly expiration week has become more bullish with DJIA, S&P 500 and NASDAQ all advancing 12 times in 17 years.
Russell 2000 remains the standout, up 13 of the last 17 with an average weekly gain of 0.94%. Covid-19 impacted performance in 2020 and 2021 and 2022’s bear market took a bite out of the week. On the heels of this week’s weakness, next week could reverse the recent losing streak provided CPI does not disappoint on Valentine’s Day.
(CLICK HERE FOR THE CHART!)
Jobless Claims Above Expectations
After a few weeks of declines, jobless claims rose this week coming in at 196K on a seasonally adjusted basis compared to forecasts of a more modest increase to 190K. Albeit higher, jobless claims remain at healthy levels with this week marking the fourth in a row with a sub-200K reading.
(CLICK HERE FOR THE CHART!)
Before seasonal adjustments, claims are at a point of the year in which they tend to trend lower. As for the most recent reading, claims rose from 225K to 234K. As shown in the second chart below, while claims do tend to fall at this point of the year, the current week of the year (as well as next week) has been less consistent with declines only around half the time. In other words, on a non-seasonally adjusted basis, claims have flattened out a bit and should continue to be watched as that plateau is not necessarily going completely against usual seasonal patterns.
(CLICK HERE FOR THE CHART!)
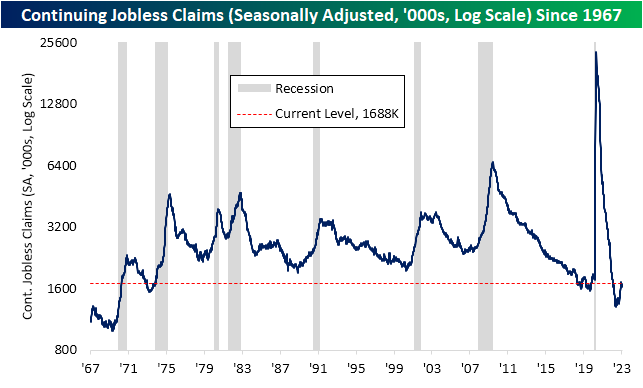
Continuing claims similarly rose by more than expected this week reaching 1.688 million, the highest level in a little over a month.
(CLICK HERE FOR THE CHART!)
While both continuing and initial claims were higher this week, the past few months have generally seen a much more pronounced rise in the former than the latter. That marks a reversal from what was observed last year when initial claims were rising without continuing claims following suit. As a result of that move, the ratio of initial to continuing claims had surged well above what has historically been the norm, peaking in the summer. Fast forward to today, that ratio moved back below the low from early last spring to reach the lowest level since October 2020.
(CLICK HERE FOR THE CHART!)
# Refis Rise
Mortgage rates have come off of recent lows with the 30-year national average from Bankrate.com currently at 6.53%. While rates are not making new lows, those are much more attractive levels than last fall when they peaked well above 7%. On a rolling 3-month basis, the decline in mortgage rates continues to rank as some of the largest since the late 1990s (after the largest increase since the 1990s).
(CLICK HERE FOR THE CHART!)
Given the alleviation on the rates front, purchase applications have been rebounding. The Mortgage Bankers Association's weekly purchase application index is currently 19.2% above the post-pandemic low put in place in the first week of the year.
(CLICK HERE FOR THE CHART!)
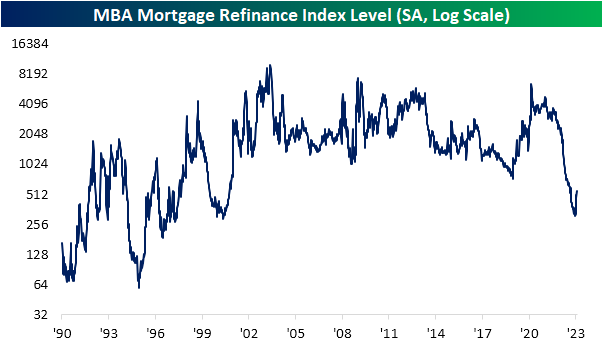
When rates were rising rapidly, massively stifling demand last year, refinance applications had taken a much larger hit than purchase applications. At the worst levels during the holidays, refinance applications reached the lowest level since May 2000. Since the start of the year, though, refinance applications have surged. Although there is still plenty of lost ground still to make up as applications continue to run below the past two decades' range, the 68% month-over-month increase in applications has been the largest jump since March 2020 when applications doubled. Of all weekly readings since 1990, the current one-month increase ranks in the top 5% of all month-over-month moves on record.
(CLICK HERE FOR THE CHART!)
(CLICK HERE FOR THE CHART!)
Do Stocks Want the Eagles or Chiefs to Win?
“Baseball is 90% mental, the other half physical.” Yogi Berra
First things first, don’t ever invest based on who wins the Super Bowl. Or the coin toss, or how bad the refs will be, etc. With that out of the way, it is Super Bowl season and that means it is time to talk about the always-popular Super Bowl Indicator!
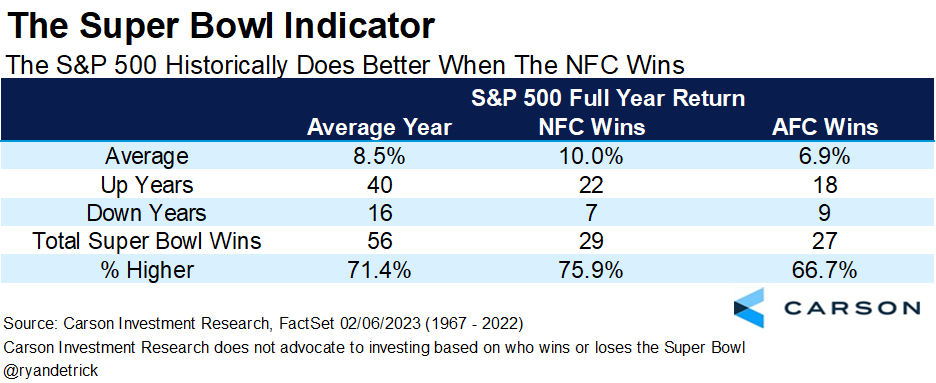
The Super Bowl Indicator suggests stocks rise for the full year when the Super Bowl winner has come from the original National Football League (now the NFC), but when an original American Football League (now the AFC) team has won, stocks fall. Of course, this is totally random, but it turns out that when looking at the previous 56 Super Bowls, stocks do better when an NFC team wins the big game. But as Yogi playfully told us in the quote above, sometimes things don’t always add up, and investing on this isn’t going to add up.
This fun indicator was originally discovered in 1978 by Leonard Kopett, a sportswriter for the New York Times. Up until that point, the indicator had never been wrong.
We like to make it a little simpler and break it down by how stocks do when the NFC wins versus the AFC, ignoring the history of the franchises. As our first table shows, the S&P 500 gained 10% on average during the full year when an NFC team won versus up less than 7% with an AFC team won. Now, this totally random indicator isn’t perfect, as the Rams won last year, and stocks had a horrible year. Yet another reason why the Gods should have let my Bengals win that game. I digress…
(CLICK HERE FOR THE CHART!)
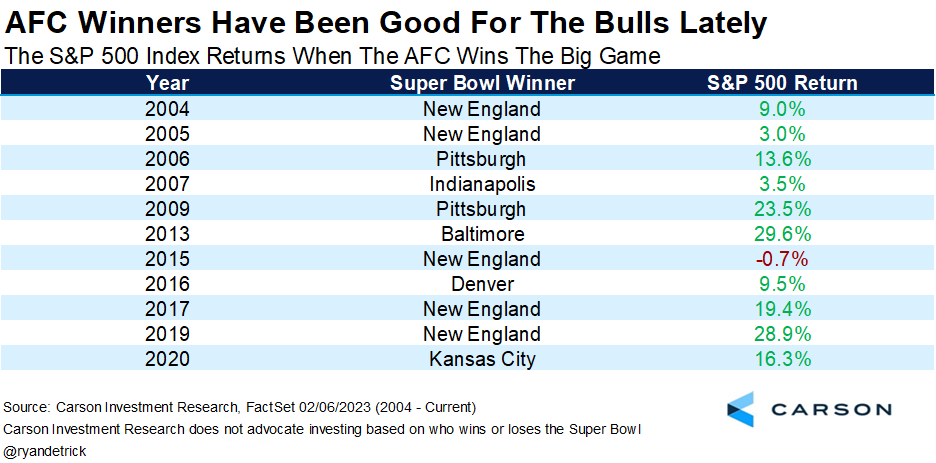
So, it is clear-cut that investors want the Eagles to fly high and win, right? Maybe not. As stocks have gained the full year 10 of the past 11 times when a team from the AFC won the championship. In fact, the only time stocks were lower was in 2015, when the full year ended down -0.7%, so virtually flat.
(CLICK HERE FOR THE CHART!)
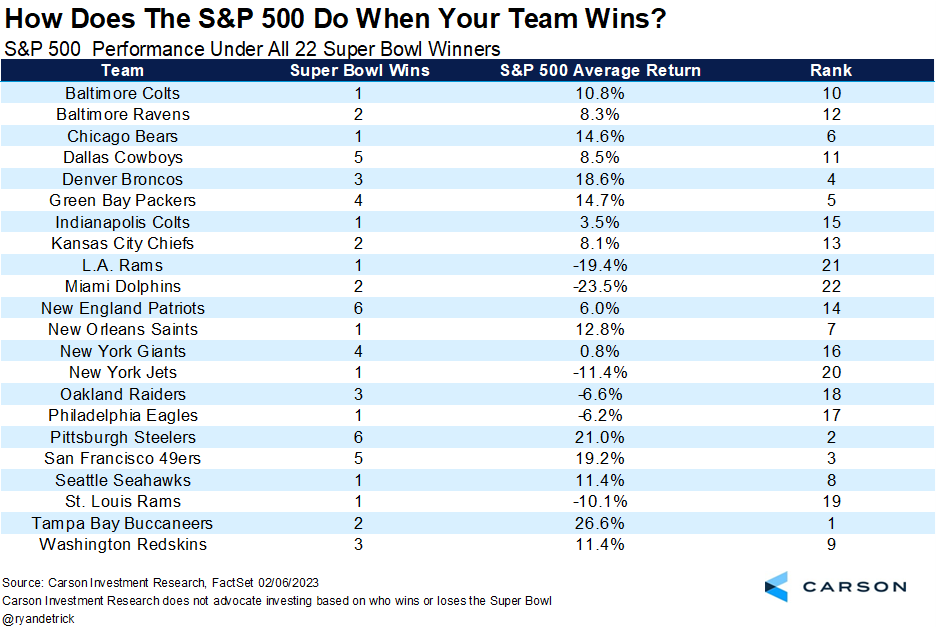
By my math, there have been 56 Super Bowls and 22 different winners. I broke things up by franchise and city. For instance, Baltimore has won three championships, with one from the Colts and two for the Ravens. So I differentiated the two. Then the Colts won one in Indy, so I broke that out as well. Either way, I still don’t see my Bengals on here, but I expect that the change next year in Vegas at the Super Bowl in February 2024.
Getting to the two teams in it this year, the Chiefs have won twice and stocks gained 8.5%, about average, while when the Eagles won in 2018, stocks finished lower for the year.
(CLICK HERE FOR THE CHART!)
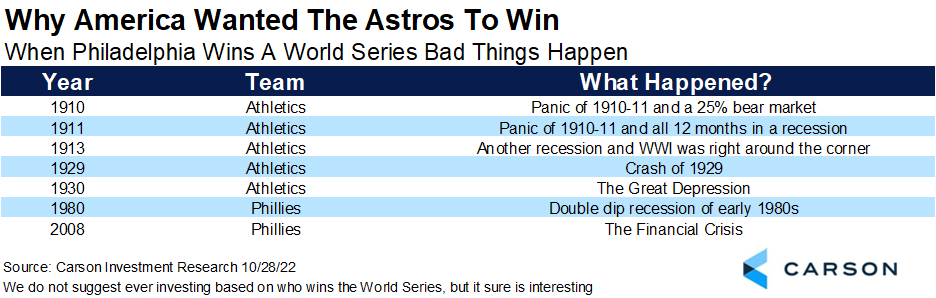
Speaking of Philly championships, here was a fun one we shared during the World Series. Turns out, very bad things happened when the City of Brotherly Love won the World Series. I’m talking panics, depressions, recessions, and financial crises. Maybe we shouldn’t be rooting for Philly now?
(CLICK HERE FOR THE CHART!)
Perhaps investors have been looking at it all wrong though?
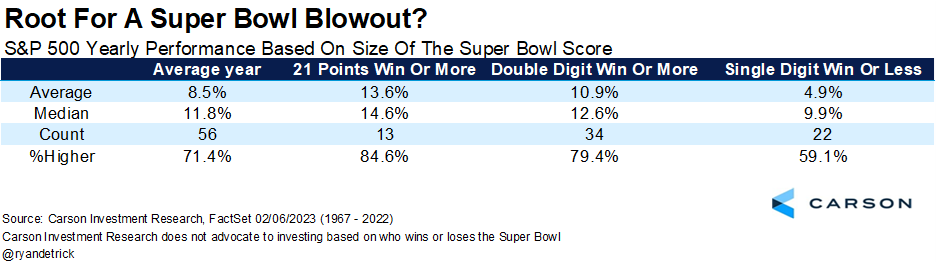
It might not matter who wins, but by how much they win. I was looking at the data and noted the Bengals lost by only three last year to the Rams, and stocks did poorly. Then I saw that some years with lopsided scores had some great market returns and vice versa. Well, wouldn’t you know it? The larger the size of the win, the better stocks do. (Let’s have another disclosure that nearly everything I’m saying here isn’t in any way, shape, or form related to what stocks actually do, and you shouldn’t use it as such)
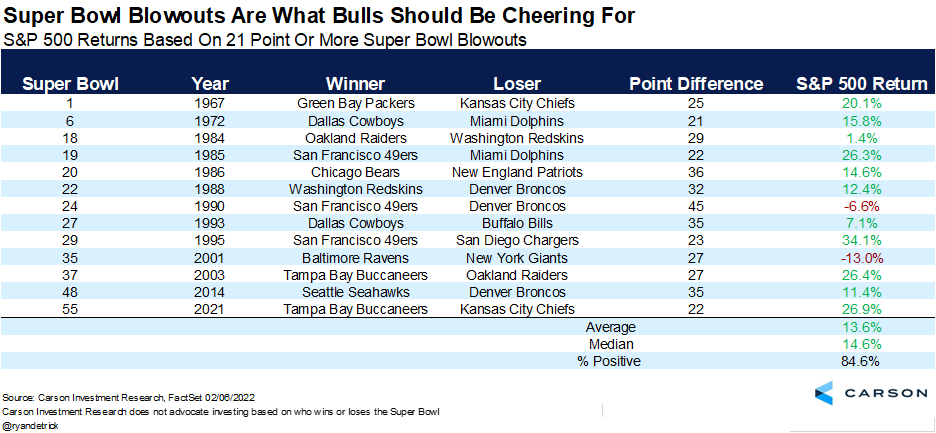
That’s right, when it is a single-digit win in the Super Bowl, the S&P 500 is up less than 5% on average and higher less than 60% of the time. A double-digit win? Things jump to about 11% and 79%. And wouldn’t you know it, when the final score is three touchdowns or more, the S&P 500 gained 13.6% for the year and is higher about 85% of the time.
(CLICK HERE FOR THE CHART!)
Here’s a list of all the big blowouts and what happened to stocks those years. Not too bad, huh?
(CLICK HERE FOR THE CHART!)
Here are ten other takeaways I noticed while slicing and dicing the data:
* The NFC has won 29 Super Bowls and the AFC 27.
* The Steelers and Pats have won the most at six.
* As great as Peyton Manning was, he only won one Super Bowl. His brother won two.
* The NFC won two in a row and hasn’t won three in a row since the Saints, Packers, and Giants in 2010, 2011, and 2012.
* The NFC won 13 in a row from 1985 (Bears) until 1997 (Packers).
* The Bills made the Super Bowl four consecutive years, losing each time.
* The highest-scoring game was 75 total points in 1995 between the 49ers and Chargers.
* The lowest-scoring game was only 16 points in 2019 when the Pats beat the Rams.
* The closest ever was a one-point win for the Giants over the Bills in 1993 (the Scott Norwood game).
* In 1990 the 49ers beat the Broncos by 45 for the largest win ever.
* So, there you have it, your complete breakdown for the big game. I’m saying the Eagles, as they have the best offensive and defensive lines. But Mahomes and Chiefs are awesome, and it’ll likely be a great game. In the end, I just hope the refs don’t ruin it with bad calls all against one team like they did in the AFC Championship. Make it an even game for both teams, Zebras!
Past performance is not an indication or guarantee of future results.
Five Clues This Isn’t Just a Bear Market Rally
“When the facts change, I change my mind. What do you do, sir?” John Maynard Keynes
Stocks are off to a roaring start to 2023, which has many claiming this is just a bear market rally and one that will likely end with new lows. Carson Investment Research has quietly been taking the other side to these vocal bears, saying many times that October was likely the end of the bear market and that better times were potentially in the cards. In fact, we upgraded our view on equities to overweight from neutral in late December and added equity risk to the models we run for our Partners as a result.
Two big reasons for our optimism are that we don’t see a recession this year, and everyone is bearish. Regarding the macro outlook, last week’s 517k jobs number does little to change our stance. Additionally, I’ve done this for a long time, and I’ve never quite seen everyone as bearish as they were late last year. Remember, the crowd is rarely right, as we discussed in Is Anyone Bullish?
The S&P 500 is up 17% from the October lows, the same magnitude as the 17% rally we saw last summer. Back then, stocks rolled back over and made new lows, something most strategists on tv are saying will happen again.
Well, the facts are changing for us, and as Keynes told us in the quote above, we had better change our minds as well. So here are five clues that this rally is on firmer footing and will likely continue.
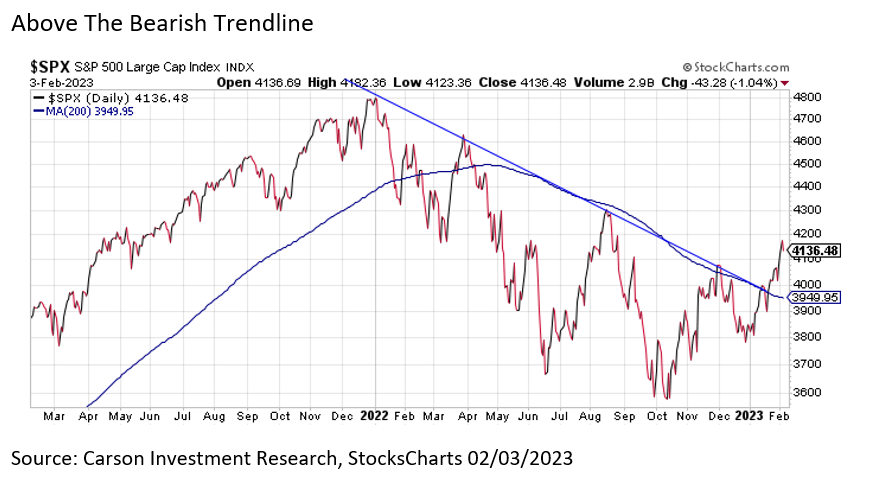
The Trendline
The S&P 500 finally broke above the bearish trendline from 2022. As you can see below, each time this trendline was touched, stocks sold off, usually hard. However, this time, stocks broke above the trendline and accelerated higher, a clear change in trend. Not to mention, the S&P 500 also moved significantly above the 200-day moving average, which clues that the trend has changed.
(CLICK HERE FOR THE CHART!)
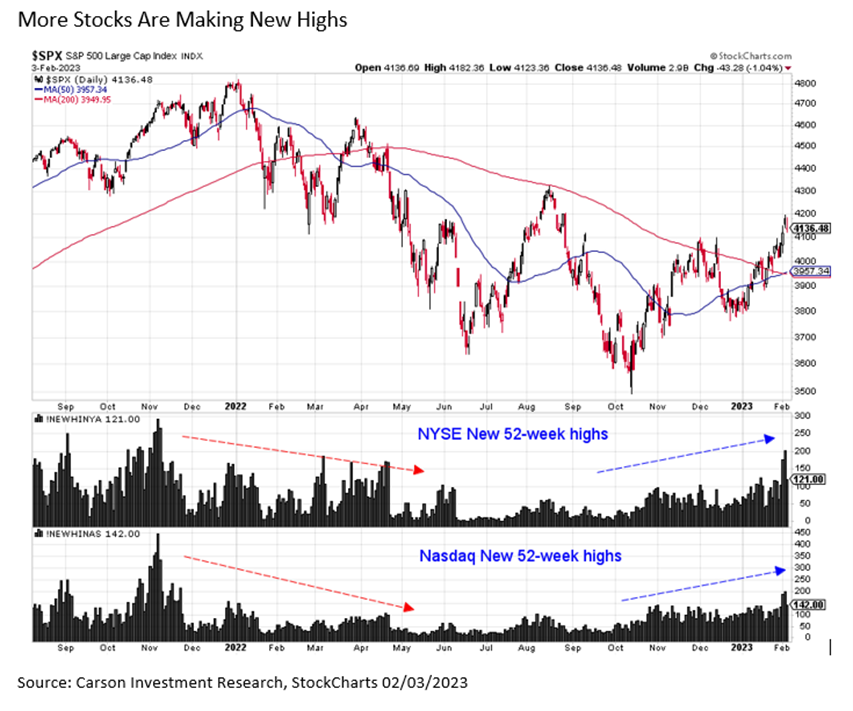
More stocks are going up.
Even though the S&P 500 is still more than 10% away from a new all-time high, we are seeing more and more stocks making new 52-week highs, yet another sign that this rally, indeed, is different. As you can see below, the first part of last year saw less and less stocks making new highs, a potential warning sign under the surface. Well, today is near 180, with more and more stocks breaking out to the upside. With more stocks strong, the likelihood that the overall indexes follow is potentially quite high.
(CLICK HERE FOR THE CHART!)
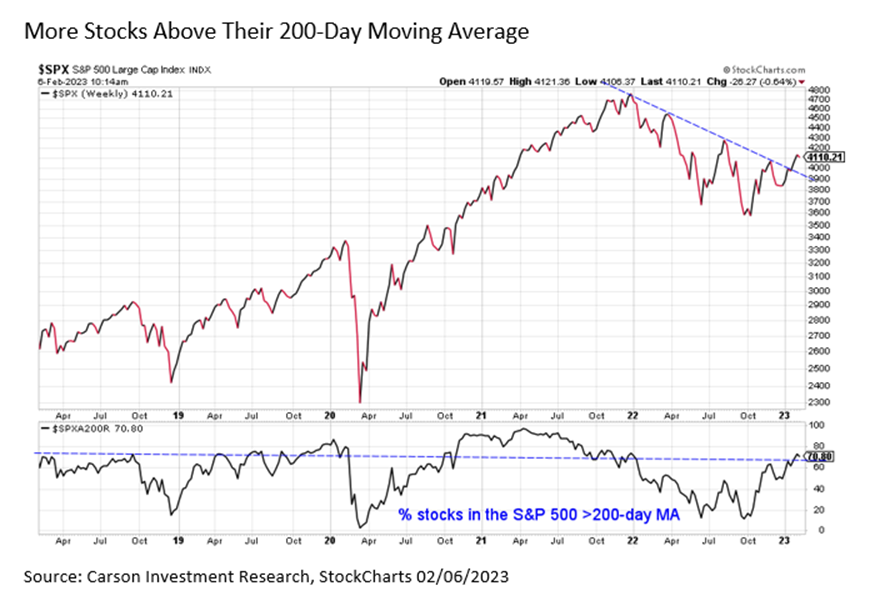
Wider breadth and participation
Another clue that more and more stocks are trending higher is that more than 70% of the stocks in the S&P 500 are above their 200-day moving average. This is mostly since late 2021; in other words, more participation than any time we saw last year. As the chart below shows, when this gets above 65%, it signals a potential shift to a stronger trending market. For example, we saw this above 65% for much of the bull market of 2021. Once this broke beneath 65% in late 2021, it was a warning sign of potential trouble brewing.
(CLICK HERE FOR THE CHART!)
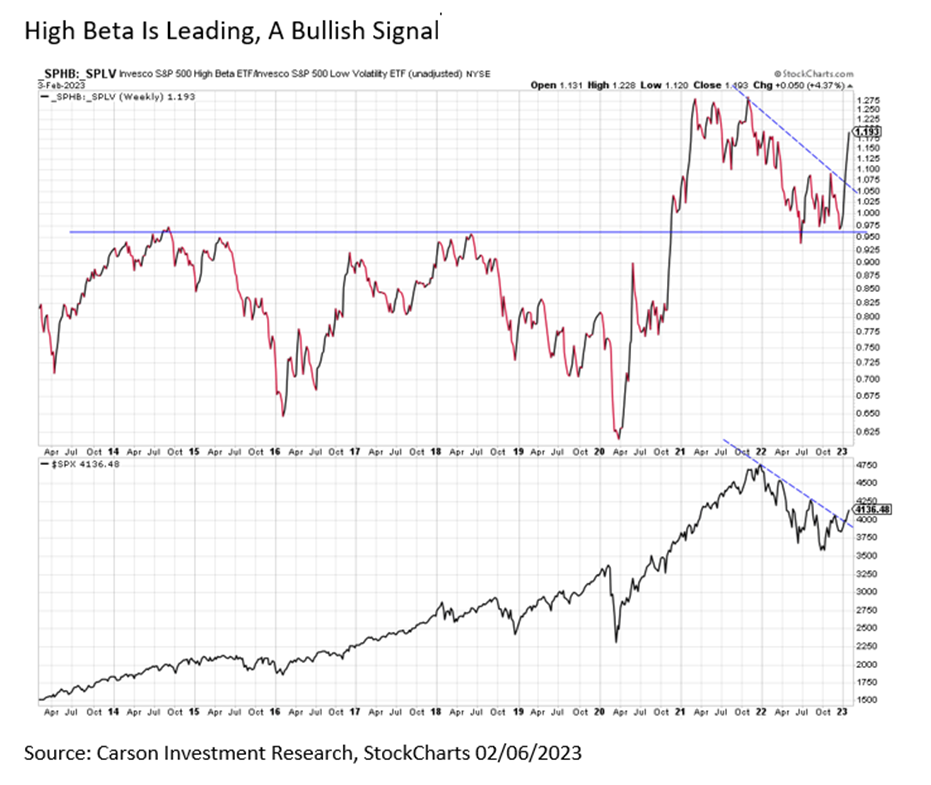
High beta is doing better.
We saw leadership from things like utilities, healthcare, and staples this time a year ago. In other words, the defensive part of the market. Today we are seeing those groups underperform, with high-beta names doing well, another clue that this rally is on better footing. So let’s sum it up like this, you don’t want the defensive stuff leading to a proper healthy bull market.
(CLICK HERE FOR THE CHART!)
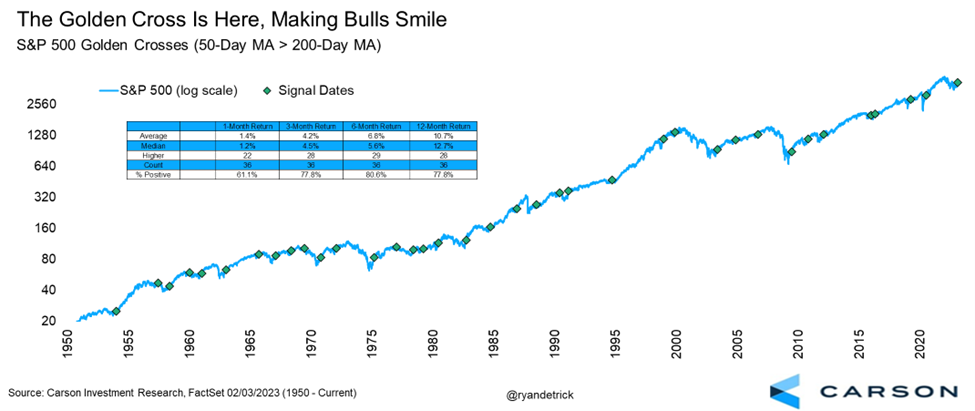
The Golden Cross
Lastly, a rare technical development took place last week on the S&P 500, as the 50-day moving average moved above the slower-trending 200-day moving average. This development is known as a “Golden Cross,” which has tended to resolve bullishly for stocks.
Since 1950, there have been 36 other Golden Crosses on the S&P 500 and the future returns have been strong, with the S&P 500 higher a year later nearly 78% of the time and up 10.7% on average, with a median return of close to 13%. The bottom line is that this is another sign that things appear to be improving more than anytime we saw last year.
(CLICK HERE FOR THE CHART!)
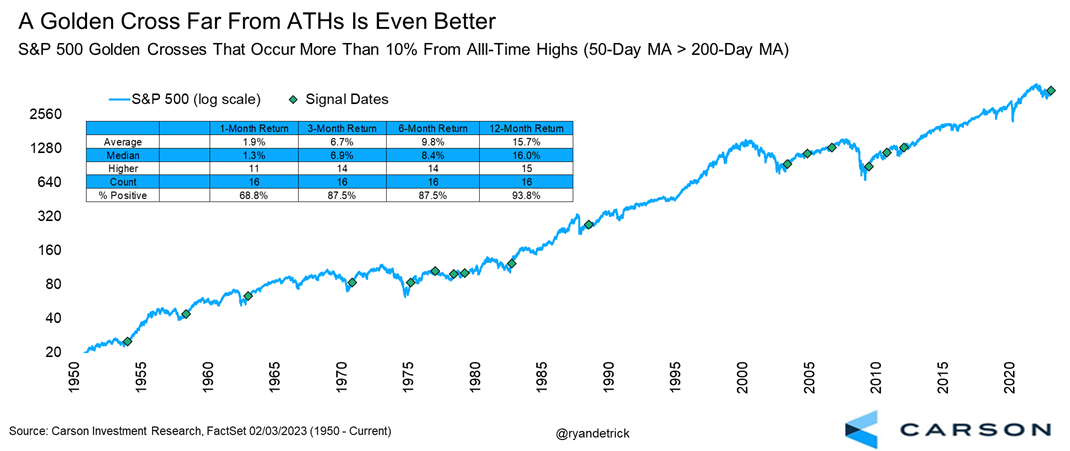
Taking it a step further, historically, this Golden Cross took place nearly 13% away from all-time highs. We looked, and when Golden Crosses happened more than 10% or more away from new highs, the future returns got better. Higher a year later, 15 out of 16 times (93.8%) and up a very solid 15.7% on average is something most bulls would likely take, I’m sure.
(CLICK HERE FOR THE CHART!)
Here are the most notable companies reporting earnings in this upcoming trading week ahead-
- (T.B.A. THIS WEEKEND.)
(CLICK HERE FOR NEXT WEEK'S MOST NOTABLE EARNINGS RELEASES!)
(CLICK HERE FOR NEXT WEEK'S HIGHEST VOLATILITY EARNINGS RELEASES!)
(CLICK HERE FOR MONDAY'S PRE-MARKET NOTABLE EARNINGS RELEASES!)
(T.B.A. THIS WEEKEND.)
(T.B.A. THIS WEEKEND.) (T.B.A. THIS WEEKEND.).
(CLICK HERE FOR THE CHART!)
DISCUSS!
What are you all watching for in this upcoming trading week?
I hope you all have a wonderful weekend and a great trading week ahead r/stocks. 🙂
Leave a Reply