Good Friday evening to all of you here on r/stocks! I hope everyone on this sub made out pretty nicely in the market this past week, and are ready for the new trading week ahead. 🙂
Here is everything you need to know to get you ready for the trading week beginning August 1st, 2022.
Stocks rally for a third day to cap a winning week, major averages post best month since 2020 – (Source)
Stocks climbed for a third consecutive session on Friday as investors digested strong tech earnings and looked past concerns about high inflation and a recessionary environment.
All of the major averages rose to a winning week and their best month of 2022. The Dow Jones Industrial Average advanced 315.50 points, or nearly 1%, to 32,845.13. The S&P 500 jumped 1.4% to 4,130.29, and the Nasdaq Composite added about 1.9% to end the day at 12,390.69.
For the week, the Dow ended higher by nearly 3%, while the S&P 500 and the Nasdaq Composite gained about 4.3% and 4.7%, respectively.
The Dow rose to a 6.7% gain for July. The S&P 500 added 9.1% for the month. The Nasdaq Composite, while still in bear market territory, is up roughly 12.4%. Those were the biggest monthly gains for all three indexes since 2020.
That performance is a stark contrast from the previous six months when stocks tumbled to their June bear market levels. The market reversed as investors’ fears about the aggressive pacing of the Federal Reserve’s interest rate increases started to wane and the idea that inflation has perhaps peaked began to settle in.
“Starting from a position of depressed sentiment and bearish positioning was an asset, but the bigger picture was a subtle shift in inflation and inflation expectations, and thus the market’s expectation for the Fed’s path,” said Ross Mayfield, investment strategy analyst at Baird. “Of late, corporate earnings resilience has only added to the bull case and likely put a near-term floor under equity markets.”
Still, some have remained worried about inflation levels with Russia’s ongoing war on Ukraine and the possibility that markets could turn lower again. On Friday, the Bureau of Economic Analysis reported that June’s personal consumption expenditures index climbed 6.8% on a 12-month basis. This inflation indicator, which is watched closely by the Fed, hit its highest level since January 1982.
“This may just prove to be a bear market rally in the end – they are very common during longer bear markets – but the combination of rate reprieve, bearish sentiment and positioning, and corporate and consumer resilience in the face of inflation has been enough to spark a rally in risk assets,” Mayfield said.
On Friday, investors also got the final reading of the University of Michigan Consumer Sentiment Index, which came in at 51.5 for July. That’s a slight improvement over the preliminary reading and up from the June all-time low of 50.
Big Tech earnings lift indexes
Nevertheless, gains from two of the market’s biggest stocks led the major averages higher. Amazon shares popped nearly 10.4% after the e-commerce giant reported stronger-than-expected sales for the previous quarter, while Apple climbed 3.2% after posting better-than-expected iPhone revenue.
Chevron and Exxon Mobil also posted better-than-anticipated results for the previous quarter, sending their shares higher by 8.9% and 4.6%, respectively.
However, the latest batch of corporate results has been mixed.
Shares of Roku sank about 23.1% after the company missed estimates and warned of a slowdown in advertising. Chipmaker Intel dropped nearly 8.6% after its quarterly results fell short of expectations.
“The market is taking a lot of comfort in the mixed earnings season because the concern was that it was not going to be mixed, that it would be more uniformly negative,” said Yung-Yu Ma, chief investment strategist at BMO Wealth Management. “That that didn’t happen allowed investors to realize that a major implication of all the risk certainties now is that we’re going to see a lot more dispersion at the individual company level.”
For example, while Intel lowered its full-year expectations, Microsoft issued a rosy income forecast for the year ahead. While Walmart cut its profit outlook, Amazon gave upbeat guidance.
“You think that their fortunes are tied together pretty closely, but you see one struggling a bit more than the other,” he said. “From one standpoint, that’s not great – it creates some uncertainty and risk around individual companies – but it’s also comforting that it’s not uniformly negative and some companies are able to manage costs, grow revenues and maintain profit margins better.”
More than half of S&P 500 companies have reported earnings, with 72% of those names beating expectations, FactSet data shows.
The week’s gains come after investors shook off a three-quarters of a percentage point hike from the Federal Reserve on Wednesday and a negative GDP reading on Thursday.
“The market is taking on a hope that slowing economic growth is going to result in a more dovish Fed moving forward, even if it’s a little further out. So it would make sense to me that weaker rates expectations moving forward would result in a little buoyancy in the equity markets,” said Lauren Goodwin, economist and portfolio strategist of New York Life Investments.
However, Goodwin cautioned that the unusual economic environment and the long period before the next Fed meeting make it difficult to predict the central bank’s path from here.
Ma agreed, saying the extent to which the market has looked past some unfavorable data points is “impressive” but that current optimism shouldn’t be taken for granted.
“That’s a residual effect of how negative the market was coming in to the month,” he said. “The market psychology comes and goes in waves and in the current environment, those waves are very much compressed, given all the uncertainty in the environment. It could be the case that some relatively modest data next week changes the market’s focus and narrative that persisted throughout much of July.”
This past week saw the following moves in the S&P:
(CLICK HERE FOR THE FULL S&P TREE MAP FOR THE PAST WEEK!)
S&P Sectors for this past week:
(CLICK HERE FOR THE S&P SECTORS FOR THE PAST WEEK!)
Major Indices for this past week:
(CLICK HERE FOR THE MAJOR INDICES FOR THE PAST WEEK!)
Major Futures Markets as of Friday's close:
(CLICK HERE FOR THE MAJOR FUTURES INDICES AS OF FRIDAY!)
Economic Calendar for the Week Ahead:
(CLICK HERE FOR THE FULL ECONOMIC CALENDAR FOR THE WEEK AHEAD!)
Percentage Changes for the Major Indices, WTD, MTD, QTD, YTD as of Friday's close:
(CLICK HERE FOR THE CHART!)
S&P Sectors for the Past Week:
(CLICK HERE FOR THE CHART!)
Major Indices Pullback/Correction Levels as of Friday's close:
(CLICK HERE FOR THE CHART!)
Major Indices Rally Levels as of Friday's close:
(CLICK HERE FOR THE CHART!)
Most Anticipated Earnings Releases for this week:
(CLICK HERE FOR THE CHART!)
Here are the upcoming IPO's for this week:
(CLICK HERE FOR THE CHART!)
Friday's Stock Analyst Upgrades & Downgrades:
(CLICK HERE FOR THE CHART LINK #1!)
(CLICK HERE FOR THE CHART LINK #2!)
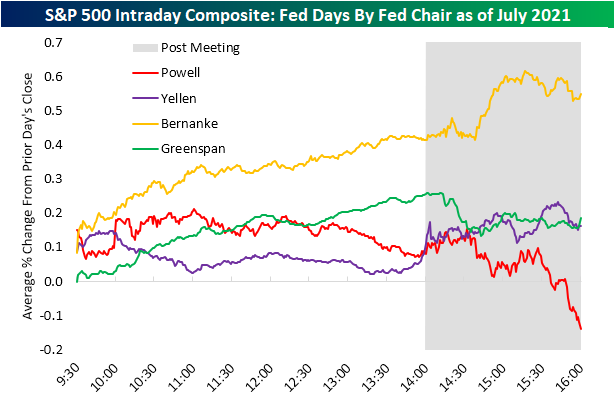
Fed Chair Powell: The Comeback Kid
The S&P 500 has gained more than 1% on each of the last four Fed Days going back to March. The March meeting was the first rate hike of the Fed's current tightening cycle, and every meeting since then has seen a hike of at least 50 basis points. Each time, the S&P surged on the day of the hike.
The recent equity market strength on Fed Days is a new trend. Market performance on Fed Days during Powell's first few years at the helm was notoriously weak. Below we show the S&P 500's average intraday performance on Fed Days by Fed chair since 1994 when policy changes first started being announced on the same day as the meeting. For Chair Powell, we show the S&P's average performance on Fed Days during his tenure only through July 2021. At the time a year ago, Powell Fed Days were by far the worst of any Fed chair, and the market typically plunged into the close after the 2 PM ET announcement.
(CLICK HERE FOR THE CHART!)
What a difference a year makes. Below we show the S&P's average intraday performance on Fed Days by Fed chair updated through the most recent FOMC meeting this week. Whereas Powell Fed Days were by far the worst for the market at this time last year, they're now the second best behind only Bernanke Fed Days.
(CLICK HERE FOR THE CHART!)
To highlight the improvement in the market response to Fed Chair Powell another way, below we show the full-day percentage change of the S&P 500 on Fed Days during Powell's tenure as well as how the cumulative averages have evolved for both the full-day change and performance from 2:30 PM ET through the close (encapsulating the market response to the presser, or the chair more directly).
As you can see, the S&P was extremely weak on Powell Fed Days early on during his tenure, but over the last year, the market has reacted extremely positively. Seven of the last eight Powell Fed Days have seen positive moves for the S&P, with the last four all seeing gains of more than 1%.
(CLICK HERE FOR THE CHART!)
Typical August Trading: Usually a Tepid Month
Money flows from harvesting once made August a great stock market month in the first half of the Twentieth Century. It was the best DJIA month from 1901 to 1951. However since then and even more recently, over the last 21-years, August has been a disappointing month. The first eight or nine trading days have historically been weak with the major indexes shedding around 0.4% to 1.2%. This weakness is then followed by a brief mid-month rally that typically lasts until the 13th trading day. From there until late month the indexes have tended to wander sideways to lower before springing back to life ahead of month’s end.
(CLICK HERE FOR THE CHART!)
August’s First Trading Day Weakest of All
On page 90 of the Stock Trader’s Almanac 2022, it is shown that the first trading days of each month combined have produced an outsized share of the market’s overall gains. However, the first trading day of August does not contribute to this phenomenon ranking worst among other First Trading Days in the 2022 Almanac. In the upcoming 2023 edition of the Almanac August’s first trading day is still the worst. In the past 24 years DJIA has risen just 36.4% (up 8, down 16) of the time on the first trading day of August. Several sizable gains in those up years, have mitigated the average first day percent change, but the median performance is a more sizable loss. Over the past 11 years, DJIA and S&P 500 have both declined 8 times.
(CLICK HERE FOR THE CHART!)
Worst Year for Sentiment On Record
Bullish sentiment measured by the weekly AAII survey has been a series of back and forth moves over the past several weeks. After reaching the highest level in over a month last week, bullish sentiment fell back down to 27.7%. Even with that decline, bullish sentiment has now managed to hold above 25% for at least three weeks in a row for the first time since the start of the year. We also must note, that the AAII survey collects data from Thursday at 12:01 AM through Wednesday 11:59 PM meaning any boost to sentiment from yesterday's FOMC post-meeting rally will not necessarily be fully captured in this report.
(CLICK HERE FOR THE CHART!)
Whereas bullish sentiment has had its fair share of back and forth moves, bearish sentiment has more consistently fallen with this week being the third sequential decline in a row. Now at 40%, bearish sentiment is at the lowest level since the first week of June.
(CLICK HERE FOR THE CHART!)
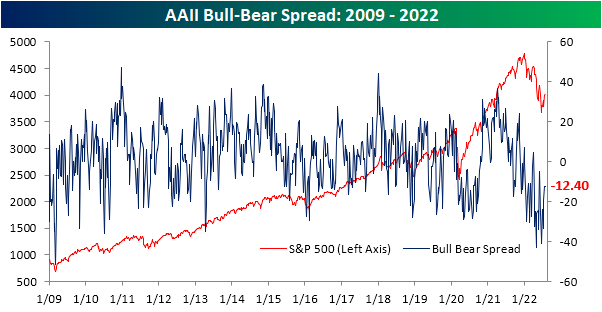
Given the drop in bulls was slightly smaller than that of bears this week, the bull-bear spread continued to move in a less negative direction. However, in spite of any improvement, this week was the 17th negative reading in a row as that streak remains the third longest on record.
(CLICK HERE FOR THE CHART!)
(CLICK HERE FOR THE CHART!)
Not only have bears outnumbered bulls for 17 straight weeks, but there has actually only been one week this year (the final week of March) in which that was not the case. As a result, this year is on pace to have averaged the lowest levels of bullish sentiment and the highest levels of bearish sentiment of any year in the survey's history.
(CLICK HERE FOR THE CHART!)
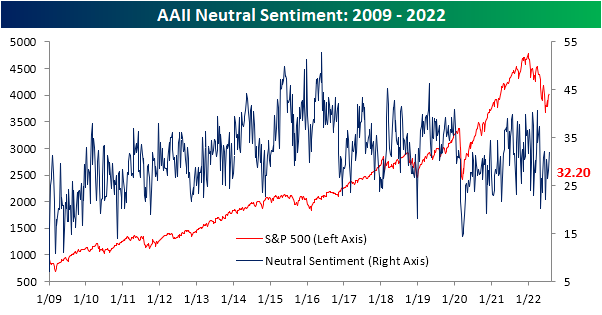
With both bulls and bears lower in the most recent survey, neutral sentiment picked up the difference rising to 32.2%. That is the most elevated reading since April and back into the middle of the post-pandemic range.
(CLICK HERE FOR THE CHART!)
Big Revision in Claims
Initial jobless claims continue to disappoint. Although this week's release technically fell down to 256K, it was from a 10K upwardly revised number of 261K last week. Both this week and last's readings are the highest since the fall and would also mark the highest readings since the fall of 2017 outside of the historically elevated readings of the pandemic.
(CLICK HERE FOR THE CHART!)
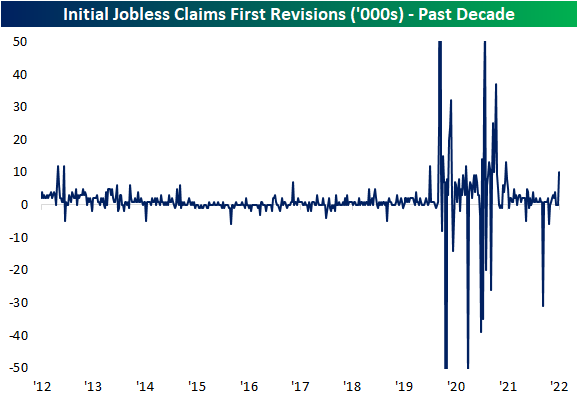
The pandemic was a volatile time period for jobless claims data as readings rose into the millions. As such, revisions over the past couple of years have gotten historically large in turn, albeit less so over the past year. Although it may not sound like much, last week's 10K revision was actually sizable. It was the largest revision since the week of July 4th last year, and prior to the pandemic, the week before Christmas in 2012 was the last time there was a double-digit revision.
(CLICK HERE FOR THE CHART!)
In his post meeting presser, Fed Chair Powell mentioned how the rise in initial jobless claims may be seasonal in nature. While we will provide some more in depth analysis to these comments in regards to the data in tonight's Closer, as we have noted in the past, jobless claims have been roughly following standard historical seasonal patterns this year. July typically sees a temporary seasonal spike higher, but as we noted last week, that seasonal peak appears to have been put in place a bit later than usual which is rare but not exactly an unprecedented occurrence. While claims will likely get some seasonal tailwinds in the coming weeks (including this week of the year as claims have fallen around 90% of the time historically), the actual level of claims for the current week of the year is now well above comparable weeks for the few years prior to the pandemic. In other words, before or after seasonal adjustment, claims have come off their strongest levels and revisions have not exactly made things any better.
(CLICK HERE FOR THE CHART!)
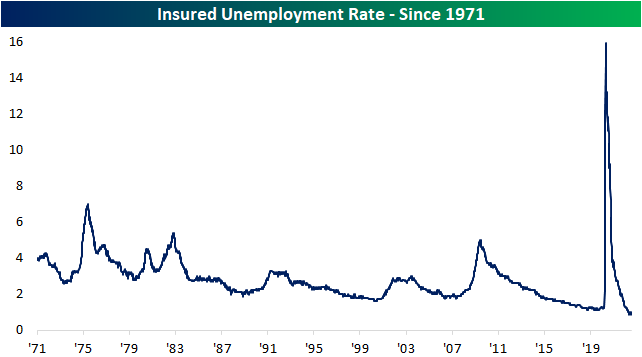
As for continuing claims, the latest week saw a 25K decline to 1.359 million. While that does mark some deterioration from the strongest levels, unlike initial claims, continuing claims are still well below levels from prior to the pandemic indicating a still very healthy labor market the likes of which has not been seen in decades as the insured unemployment rate (continuing claims as a percentage of the number of those covered by state insurance programs) continues to hover near 1%.
(CLICK HERE FOR THE CHART!)
(CLICK HERE FOR THE CHART!)
Most Countries Remain Below Pre-COVID Highs
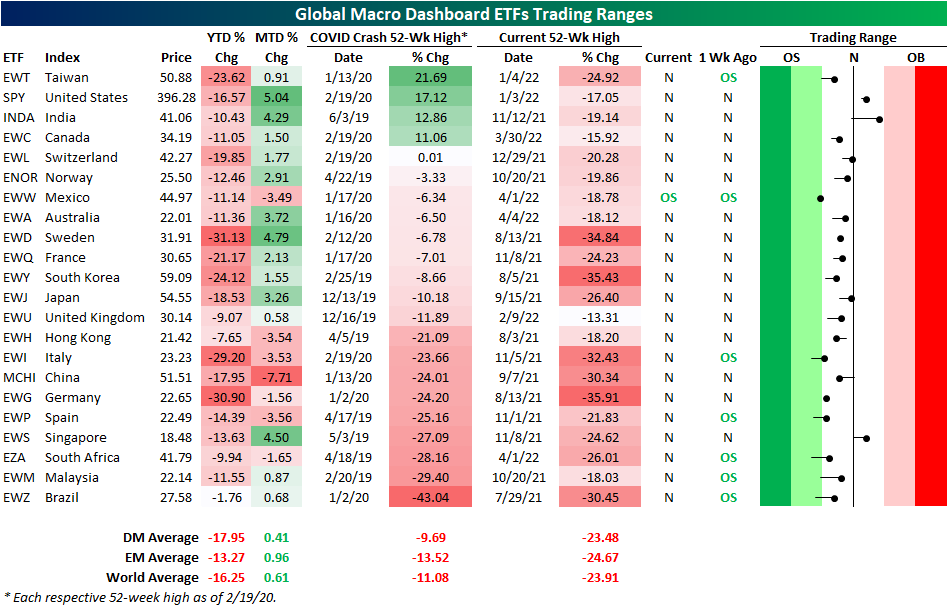
As we do the last Wednesday of each month, today we published our latest update of the Global Macro Dashboard which provides an overview of the major economic data and financial markets of 22 major global economies. Taking a look at the US ETFs tracking these same countries shows a broad move higher in equities around the globe during the month of July. The US has led the way higher as the S&P 500 ETF (SPY) has rallied just over 5%. India (INDA), Sweden (EWD), and Singapore (EWS) have seen the next strongest moves with each one rallying 4% or more. That has brought US equities, India, and Singapore back above their 50-DMAs as well.
Given those moves are in the context of much larger pullbacks year to date, most country ETFs also currently remain below their pre-COVID highs (the 52-week high as of the S&P 500 peak on 2/19/20). In fact, SPY, INDA, Taiwan (EWT), and Canada (EWC) are the only countries meaningfully above prior highs. Switzerland (EWL) is also technically a part of that list, but the one basis point difference is not much of a margin. At the moment, Brazil is down the most significantly from its pre-COVID high as it is still down 43%. However, unlike many other countries, the year-to-date decline has been very modest at only 1.76%.
(CLICK HERE FOR THE CHART!)
Taking a look at the charts of the four countries that are handily above their pre-COVID highs, the trends of the past year are not exactly positive. Each one currently sits in a multi-month downtrend, and only India and the US have managed to break above their 50-DMAs. Even if those moving averages have been taken out, further progress by bulls would be required to eliminate those downtrends.
(CLICK HERE FOR THE CHART!)
Here are the most notable companies (tickers) reporting earnings in this upcoming trading week ahead-
- (T.B.A. THIS WEEKEND.)
(CLICK HERE FOR NEXT WEEK'S MOST NOTABLE EARNINGS RELEASES!)
(CLICK HERE FOR NEXT WEEK'S HIGHEST VOLATILITY EARNINGS RELEASES!)
(CLICK HERE FOR THE MOST NOTABLE EARNINGS RELEASES FOR THE NEXT 2 WEEKS!)
(CLICK HERE FOR MONDAY'S PRE-MARKET NOTABLE EARNINGS RELEASES!)
Below are some of the notable companies coming out with earnings releases this upcoming trading week ahead which includes the date/time of release & consensus estimates courtesy of Earnings Whispers:
Monday 8.1.22 Before Market Open:
(CLICK HERE FOR MONDAY'S PRE-MARKET EARNINGS TIME & ESTIMATES!)
Monday 8.1.22 After Market Close:
(CLICK HERE FOR MONDAY'S AFTER-MARKET EARNINGS TIME & ESTIMATES!)
Tuesday 8.2.22 Before Market Open:
(CLICK HERE FOR TUESDAY'S PRE-MARKET EARNINGS TIME & ESTIMATES!)
Tuesday 8.2.22 After Market Close:
(CLICK HERE FOR TUESDAY'S AFTER-MARKET EARNINGS TIME & ESTIMATES LINK #1!)
(CLICK HERE FOR TUESDAY'S AFTER-MARKET EARNINGS TIME & ESTIMATES LINK #2!)
Wednesday 8.3.22 Before Market Open:
(CLICK HERE FOR WEDNESDAY'S PRE-MARKET EARNINGS TIME & ESTIMATES LINK #1!)
(CLICK HERE FOR WEDNESDAY'S PRE-MARKET EARNINGS TIME & ESTIMATES LINK #2!)
Wednesday 8.3.22 After Market Close:
(CLICK HERE FOR WEDNESDAY'S AFTER-MARKET EARNINGS TIME & ESTIMATES LINK #1!)
(CLICK HERE FOR WEDNESDAY'S AFTER-MARKET EARNINGS TIME & ESTIMATES LINK #2!)
(CLICK HERE FOR WEDNESDAY'S AFTER-MARKET EARNINGS TIME & ESTIMATES LINK #3!)
Thursday 8.4.22 Before Market Open:
(CLICK HERE FOR THURSDAY'S PRE-MARKET EARNINGS TIME & ESTIMATES LINK #1!)
(CLICK HERE FOR THURSDAY'S PRE-MARKET EARNINGS TIME & ESTIMATES LINK #2!)
(CLICK HERE FOR THURSDAY'S PRE-MARKET EARNINGS TIME & ESTIMATES LINK #3!)
Thursday 8.4.22 After Market Close:
(CLICK HERE FOR THURSDAY'S AFTER-MARKET EARNINGS TIME & ESTIMATES LINK #1!)
(CLICK HERE FOR THURSDAY'S AFTER-MARKET EARNINGS TIME & ESTIMATES LINK #2!)
(CLICK HERE FOR THURSDAY'S AFTER-MARKET EARNINGS TIME & ESTIMATES LINK #3!)
Friday 8.5.22 Before Market Open:
(CLICK HERE FOR FRIDAY'S PRE-MARKET EARNINGS TIME & ESTIMATES!)
Friday 8.5.22 After Market Close:
([CLICK HERE FOR FRIDAY'S AFTER-MARKET EARNINGS TIME & ESTIMATES!]())
(T.B.A. THIS WEEKEND.)
(T.B.A. THIS WEEKEND.) (T.B.A. THIS WEEKEND.).
(CLICK HERE FOR THE CHART!)
DISCUSS!
What are you all watching for in this upcoming trading week?
I hope you all have a wonderful weekend and a great trading week ahead r/stocks. 🙂
Leave a Reply