Good Thursday evening to all of you here on r/stocks! I hope everyone on this sub made out pretty nicely in the market this week, and are ready for the new trading week ahead. 🙂
Here is everything you need to know to get you ready for the trading week beginning April 10th, 2023.
S&P 500 ends Thursday higher, but suffers its first down week in four: Live updates – (Source)
Tech stocks lifted the S&P 500 into the green Thursday as the market wrapped up the short trading week on a high note despite signs of a weakening labor market.
The S&P 500 rose 0.36% to 4,105.02 after losing as much as 0.50% earlier. The tech-heavy Nasdaq Composite outperformed with a 0.76% gain to 12,087.96, boosted by a 3.78% rise in Google-parent Alphabet and a 2.55% rally in Microsoft shares. The Dow Jones Industrial Average inched 2.57 points higher to 33,485.29 after losing more than 150 points at its session low.
The S&P 500 still lost 0.1% on the week, posting its first losing week in four. The tech-heavy Nasdaq fell 1.1% this week, while the 30-stock Dow rose 0.6%.
The market remained volatile as the latest weekly jobless claims came in higher than expected, adding to recent signals that pointed to slowing job growth. The expansion in private payrolls was well below expectations in March, ADP said earlier this week. Meanwhile, the number of available positions fell below 10 million in February — a first in almost two years. Job cuts have also soared by nearly fivefold so far this year from a year ago.
Over the past several months, investors had cheered signs of economic cooling on the hope that it could push the Federal Reserve to change course on its interest rate hiking campaign. But they are now wondering if the central bank has gone too far in its bid to cool inflation, tightening the economy to the point of a recession.
“The Fed built a wall with interest rates and now the economy is running into it,” said Jamie Cox, managing partner at Harris Financial Group.
Thursday capped off a shortened trading week with the market closed for Good Friday. Investors will still closely monitor March jobs report Friday morning. Nonfarm payrolls have been showing solid growth despite layoffs across tech and financial sectors, but many believe the trend is poised to reverse soon.
Jobless claims data “lends credence to the idea that the Fed’s rate hikes are beginning to cool down the labor market and slow down the economy,” said Chris Zaccarelli, CIO at Independent Advisor Alliance. “The odds are much higher that it will cause a recession – and even a significant recession – than most people are currently willing to believe.”
This past week saw the following moves in the S&P:
(CLICK HERE FOR THE FULL S&P TREE MAP FOR THE PAST WEEK!)
S&P Sectors for this past week:
(CLICK HERE FOR THE S&P SECTORS FOR THE PAST WEEK!)
Major Indices for this past week:
(CLICK HERE FOR THE MAJOR INDICES FOR THE PAST WEEK!)
Major Futures Markets as of Friday's close:
(CLICK HERE FOR THE MAJOR FUTURES INDICES AS OF FRIDAY!)
Economic Calendar for the Week Ahead:
(CLICK HERE FOR THE FULL ECONOMIC CALENDAR FOR THE WEEK AHEAD!)
Percentage Changes for the Major Indices, WTD, MTD, QTD, YTD as of Friday's close:
(CLICK HERE FOR THE CHART!)
S&P Sectors for the Past Week:
(CLICK HERE FOR THE CHART!)
Major Indices Pullback/Correction Levels as of Friday's close:
(CLICK HERE FOR THE CHART!)
Major Indices Rally Levels as of Friday's close:
(CLICK HERE FOR THE CHART!)
Most Anticipated Earnings Releases for this week:
(CLICK HERE FOR THE CHART!)
Here are the upcoming IPO's for this week:
(CLICK HERE FOR THE CHART!)
Friday's Stock Analyst Upgrades & Downgrades:
(CLICK HERE FOR THE CHART LINK #1!)
(CLICK HERE FOR THE CHART LINK #2!)
A Big Win for the Bulls
“We may not know where we are going, but we better know where we stand.” Howard Marks, Co-Founder of Oaktree Capital Management
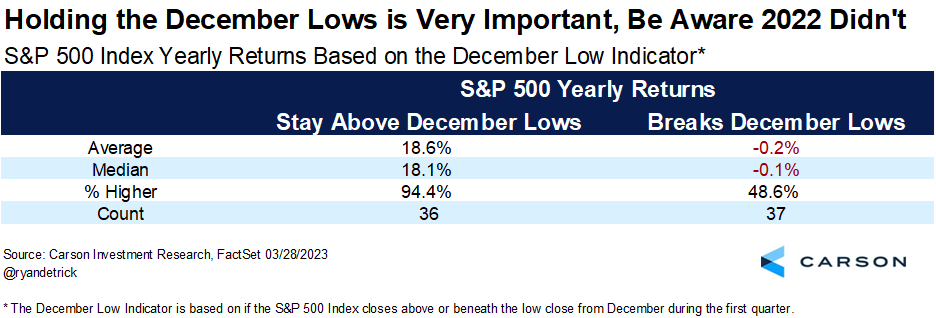
A little-known technical indicator triggered in the first quarter, and it could bring smiles to the bulls. This one is known as the December Low indicator, and it is fairly straightforward: when the S&P 500 doesn’t close beneath the December low close, good things have tended to happen the rest of the year. The opposite, of course, is when the December lows are violated in the first quarter. To refresh your memory, that is exactly what happened last year and was one subtle clue that the odds of a dicey rest of ’22 had increased. Given that stocks didn’t break their December low this year, this is one less worry for sure.
Interestingly, since 1950, stocks held above the December lows 36 times while they broke the lows 37 times. Talk about even Steven. Those are some pretty big sample sizes, and sure enough, the results are quite conclusive.
Those 36 times the December lows held? The full year was up an incredible 34 times and up an average of 18.6%. The times it failed? The full year was down 0.2% on average and higher less than a coin flip.
(CLICK HERE FOR THE CHART!)
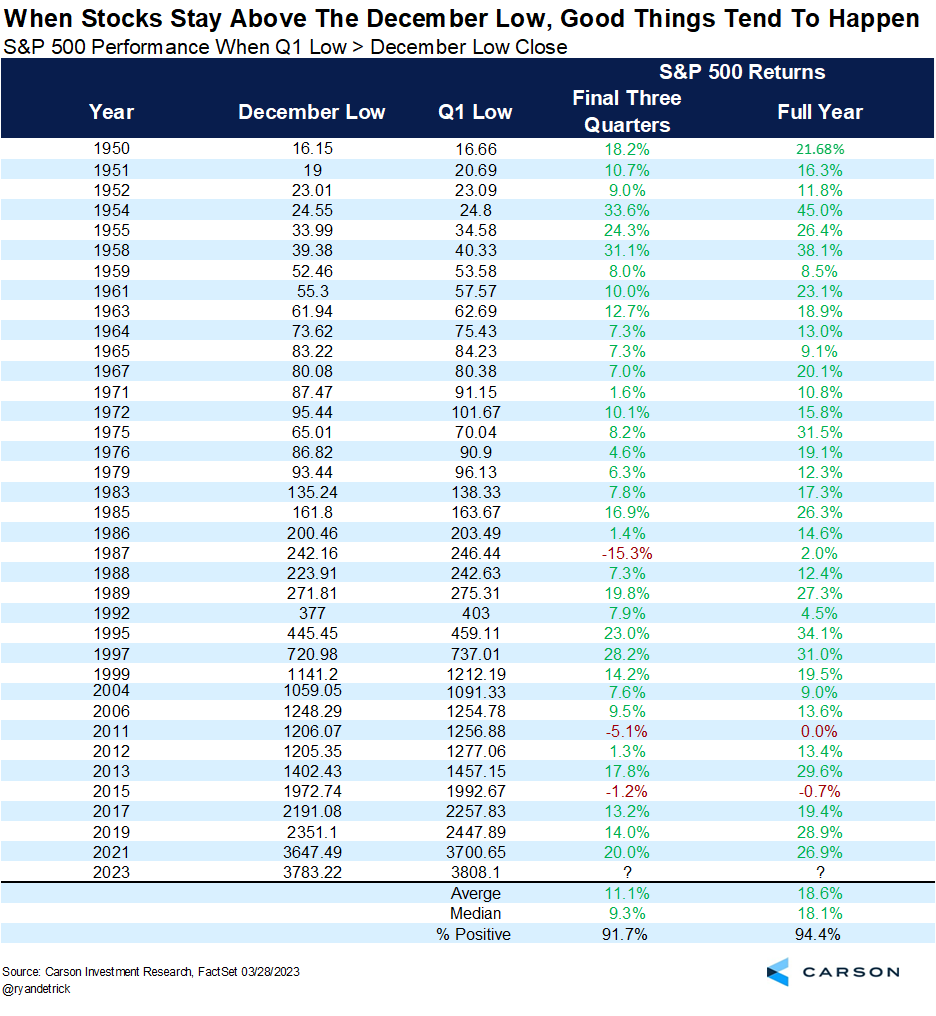
If you wanted to investigate things closer, here are all 36 times it held above the December lows. I added what happened the rest of the year (so the next three quarters) as well, and once again, strong performance was quite normal. We get it. Anything could happen from here, but the truth is it would be quite abnormal to expect a massive bear market and a horrible year for stocks this year.
(CLICK HERE FOR THE CHART!)
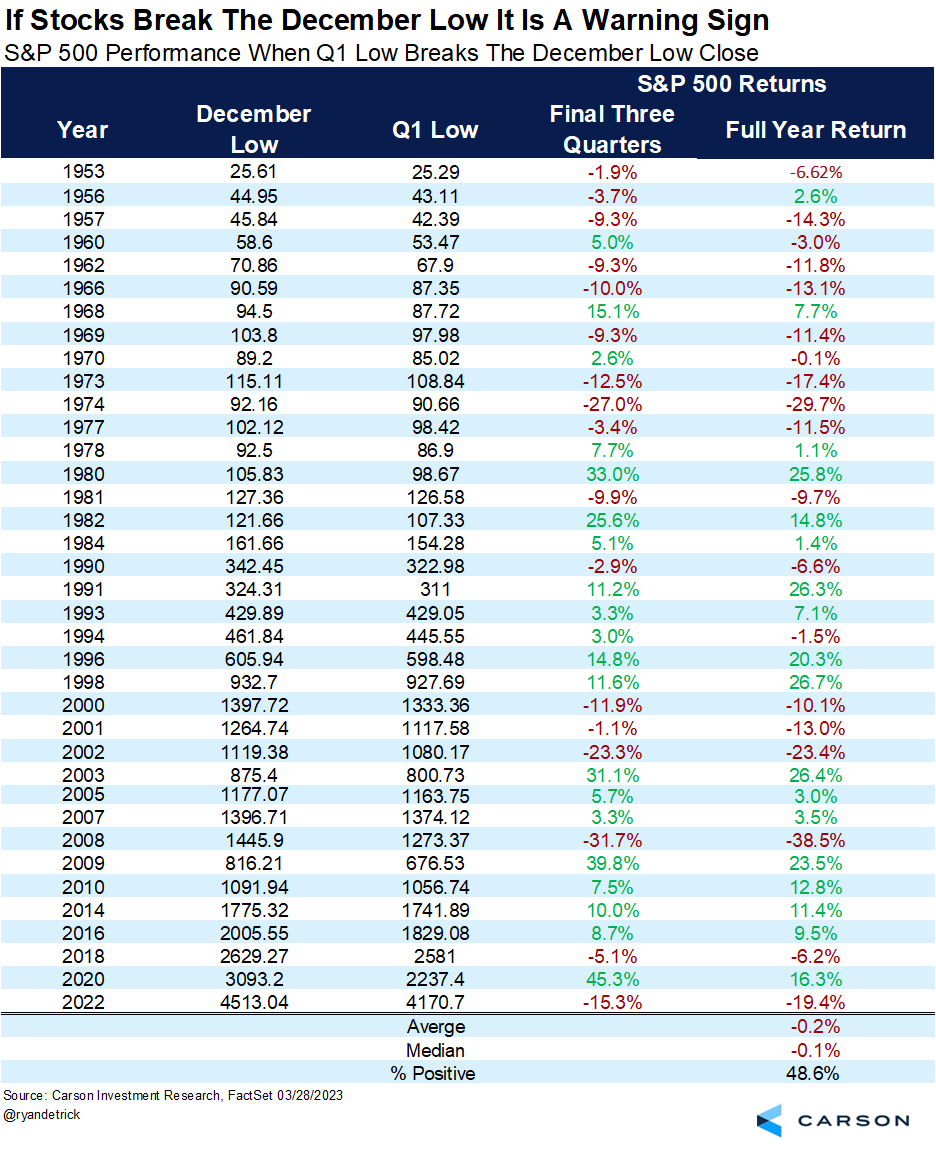
Here’s the other side to things; what happened when the December low was violated? Once again, the full year and the next three quarters’ returns were much different and weaker. Just a quick glance and some of the worst years ever saw the December lows broken. Years like ’73, ’74, the tech bubble, ’08, and ’22 all made this infamous list.
(CLICK HERE FOR THE CHART!)
Odds are, as you read this, I will be on a beach in the Turks and Caicos for Spring Break. (You caught me, I wrote this last week.) So as of right now, I’m not overly concerned about this potentially bullish development; I’m more into those fruity drinks with umbrellas in them, but once I get back home, you better believe this will be one that I’ll be focusing on closely. Or, as Howard Marks said in the quote above, we don’t know where we are going, but we do know we stand on potentially a better backdrop for stocks than most think.
What Would Moses Do? Sell Passover
If Moses were trading stocks in the 21st Century, he would be wise to the seasonal cycles that move the markets year after year and know that Passover is the time to begin considering some portfolio spring cleaning.
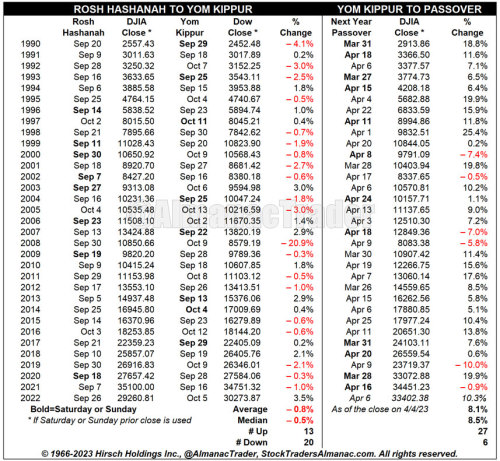
The full Hebrew calendar trading strategy is “Sell Rosh Hashanah-Buy Yom Kippur-Sell Passover.” Passover conveniently occurs in March or April, right near the end of our “Best Six Months” strategy and it’s no coincidence that Rosh Hashanah and Yom Kippur fall in September and/or October, two dangerous and opportune months.
DJIA is up 81.8% of the time from Yom Kippur to Passover since 1990 with an average gain of 8.1%.On the flipside DJIA is up 62.5% from Passover to Yom Kippur with an average gain of only 1.2% (not shown). DJIA is up 10.3% since Yom Kippur 2022 as of today’s close.
(CLICK HERE FOR THE CHART!)
Claims Get Revised
Jobless claims were in focus this morning as seasonally adjusted initial claims were surprisingly high at 228K versus expectations of 200K. Previously, adjusted claims had consistently come in well below 200K with 10 readings below that level in the last 11 weeks. However, that large increase in the most recent week's data was matched with large revisions to the past couple of years' data as the BLS updated its seasonal adjustment methodology. The net impact of those changes was to redistribute claims throughout the year, revising up readings from Q1 and Q4 while Q2 and Q3 were revised down; total or average annual readings were not changed. As discussed in greater detail on the BLS website and we will review in more depth in tonight's Closer, there are two methods for seasonal adjustment: multiplicative or additive. Most of the time the claims data has used multiplicative seasonal factoring, but periods like the first year of the pandemic in which the indicator experiences unusually large level increases means an additive approach becomes more apt. This week, the BLS applied a new hybrid approach with additive factoring applied from early March 2020 through mid-2021 and multiplicative factoring for all other periods.
As shown below, that change back to multiplicative factoring resulted in some large revisions for initial claims over the past couple of years. In turn, that has dramatically changed the picture jobless claims have painted. Previously (red line in chart below) claims had been more or less trending sideways after bottoming around a year ago, but after these revisions (blue line) claims are trending upwards and bottomed this past September. In addition, the upward revision to 247K to the print from two weeks ago would mark the highest level since January 2022.
(CLICK HERE FOR THE CHART!)
As for the non-seasonally adjusted data, the story is much less noisy being unaffected by the aforementioned revisions. In other words, the overall picture for claims hasn't changed when looking at this series. Claims remain near historically healthy levels consistent with the few years prior to the pandemic. Granted, those are off the strongest readings from last year. At this point of the year, claims are also trending lower as could be expected based on seasonal patterns. The next couple of weeks may see claims move higher because of seasonality, though, that would likely prove to be a temporary bump in the road with claims resuming the trend lower through the late spring.
(CLICK HERE FOR THE CHART!)
The revision likewise impacted continuing claims which rose to 1.823 million in the most recent week. That brings claims back up to the highest levels since December 2021 as they have risen sequentially for three weeks in a row.
(CLICK HERE FOR THE CHART!)
Sentiment Back to Bullish
Sentiment saw a huge rebound this week based on the latest AAII survey. With the S&P 500 taking out early March highs late last week, bullish sentiment jumped 10.8 percentage points to 33.3%. Although there was a higher level of bullish sentiment as recently as February 16th, this week's increase was the largest WoW jump since June of last year. Even though a double-digit jump in bullish sentiment sounds significant, S&P 500 performance has been unremarkable following similar instances historically.
(CLICK HERE FOR THE CHART!)
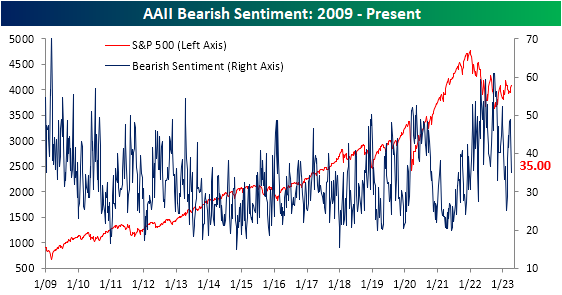
The rise in bullish sentiment borrowed almost entirely from those reporting as bearish. Bearish sentiment fell 10.6 percentage points down to 35%. That is the lowest reading since mid-February and the first double-digit drop since November.
(CLICK HERE FOR THE CHART!)
The huge shift in favor of bulls this week resulted in the bull-bear spread narrowing to -1.7 points. That is the least negative reading in the spread since February when the bull-bear spread had broken a record streak of bearish readings.
(CLICK HERE FOR THE CHART!)
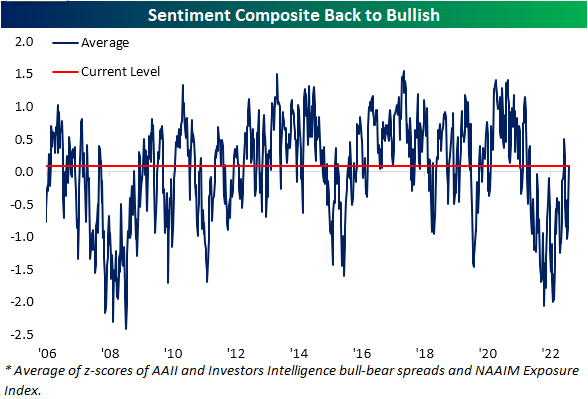
As we noted last week, the AAII survey has been a holdout in showing more optimistic sentiment readings. Whereas other sentiment surveys like the NAAIM exposure index and the Investors Intelligence survey had essentially returned to historical averages, the AAII survey saw firmly bearish sentiment readings with a bull-bear spread of 1.6 standard deviations from its historical average as of last week. Given the quick turnaround this week, the AAII survey is no longer weighing on our Sentiment Composite as it moved back into positive territory indicating bullish sentiment for only the fourth week since the start of 2022.
(CLICK HERE FOR THE CHART!)
Looming Debt Ceiling Crisis 2011 Déjà Vu
(CLICK HERE FOR THE CHART!)
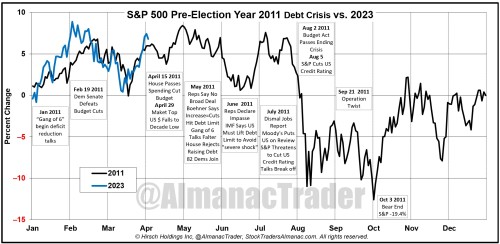
Let’s not forget about the looming debt ceiling crisis. It is the same political set up as pre-election year 2011: Democratic President with a split Congress composed of a Democratic Senate majority and a Republican House majority.
The banking crisis may have been averted, at least for the time being. War in Ukraine drags on, but it still appears more like a protracted Cold War 2.0 scenario that the market has shrugged off. The earnings trough may indeed be ending. But! Let’s be devil’s advocates here.
The standoff in 2011 between the White House and House Republicans is eerily similar to what’s developing in 2023. Markets topped out on the last trading day of April 2011 and entered a mini-bear phase with S&P down 19.4% on a closing basis before bottoming on October 3.
2011’s Worst Six Months were negative with the Dow down 6.7% and S&P down 8.1%. NASDAQ’s Worst 4 Months July-October were down 3.2%. S&P finished the year essentially flat at -0.003%, Dow was up 5.5%, NASDAQ was off 1.8% on the year.
Uncertainty & headwinds can take a bite out of usual pre-election year gains. Heeding our Best 6 Months MACD Sell Signal when it triggers will likely be the prudent course of action. Review your portfolio. Get prepared to lock in these BSM gains, sell losers & tighten stops.
3 Reasons the Dollar Isn’t Going Away Anytime Soon
There’s always been talk about the U.S. dollar (USD) losing its dominant currency status globally, but lately, the chatter seems to have increased, especially since Russia’s invasion of Ukraine, which saw the US impose severe and expansive sanctions on Russia and Russian officials – enabled by the fact that the US treasury has jurisdiction over any transaction that involves the flow of USD. Rising tensions between the US and countries like China and Saudi Arabia have also raised concerns that these countries could price oil sales in Chinese yuan, denting the USD’s dominance in the global oil trade. Never mind the fact that these talks have been going on for several years now.
The reality is this: the USD’s dominant role is not going to end any time soon, especially since there’s no good alternative. Let’s walk through 3 reasons why, using some great data from a recent Federal Reserve report.
1. The World has confidence in the US, and thereby the U.S. dollar
This confidence doesn’t come out of nowhere. As the Fed report notes, a key function of a currency is:
“A store of value which can be saved and retrieved in the future without significant loss of purchasing power.”
The US has the world’s deepest and most liquid financial markets thanks to the following:
The size of the US economy
The strength of the US economy
Open trade and capital flows, with fewer restrictions than a lot of other countries
Strong rule of law, and property rights, with a history of enforcing them
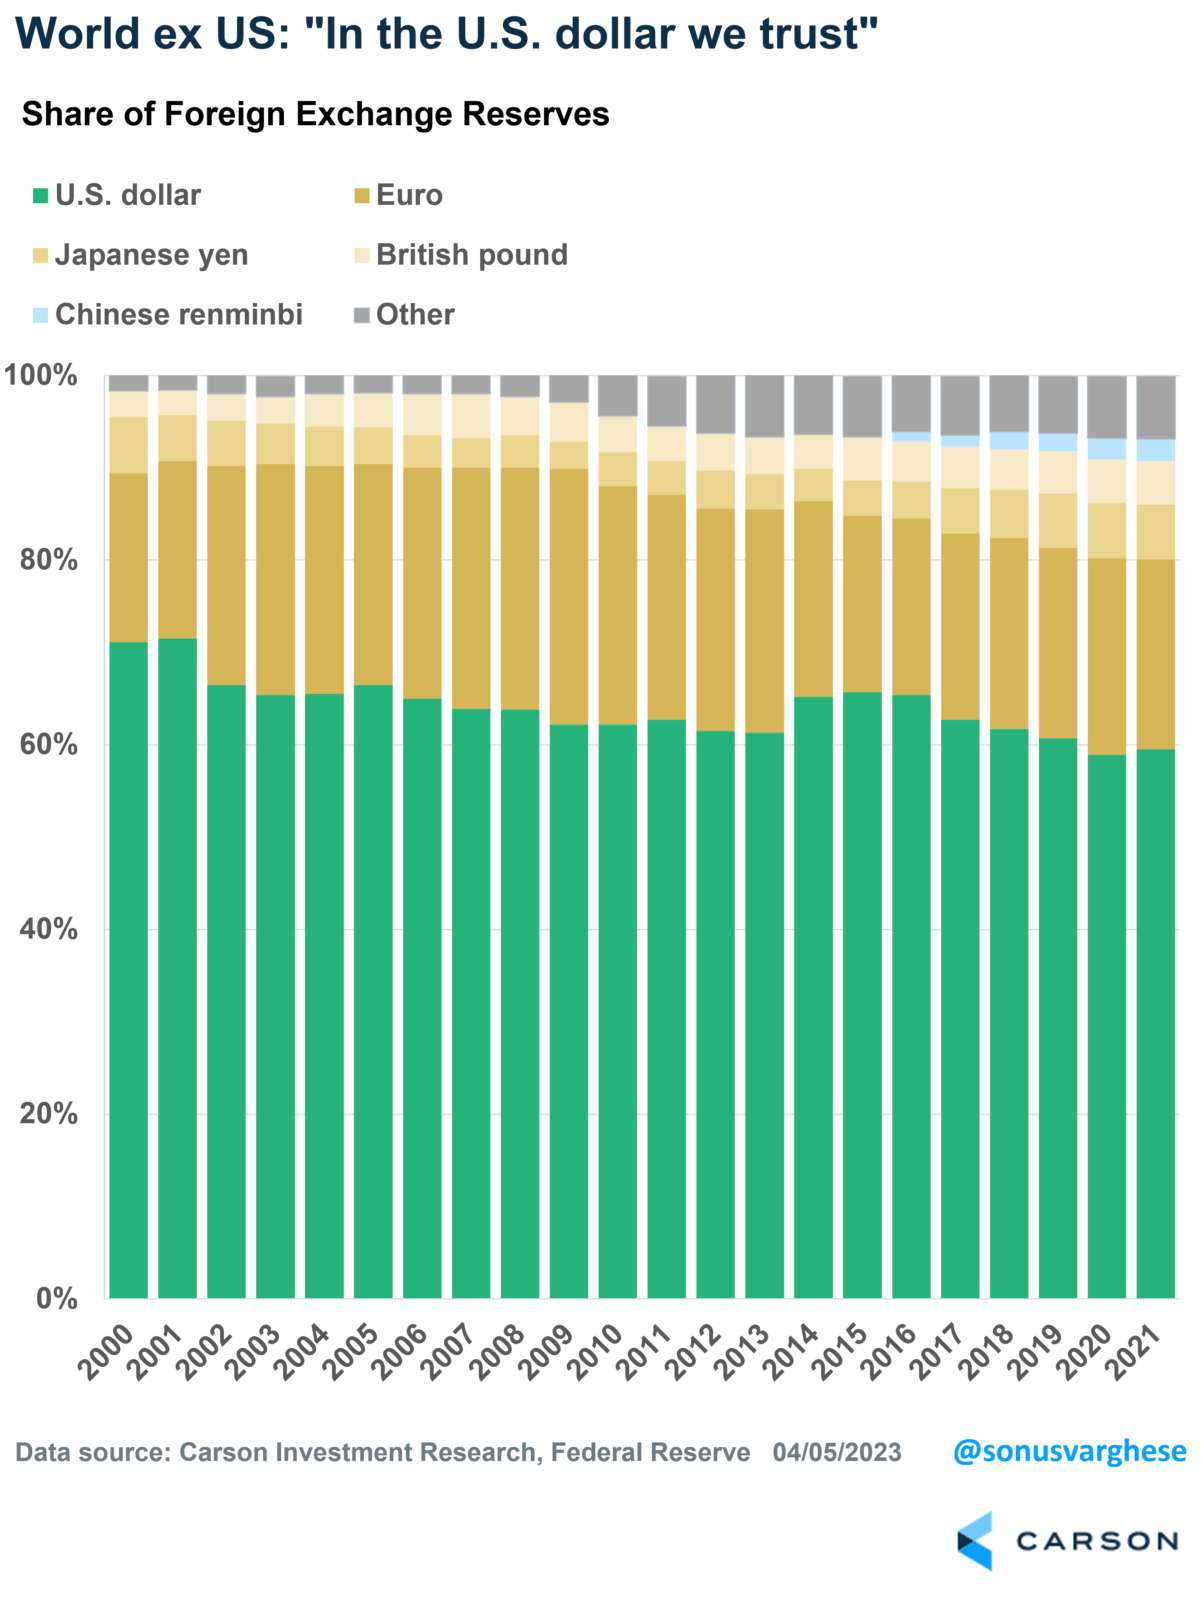
This is why, despite the US making up just about 25% of the world economy, about 60% of global foreign currency reserves are denominated in USD. This has fallen from about 71% in 2000 but is still far ahead of other currencies, including the euro (21%), yen (6%), British pound (5%), and Chinese renminbi (2%). And the decline has been taken by various other currencies, as opposed to a single other one.
(CLICK HERE FOR THE CHART!)
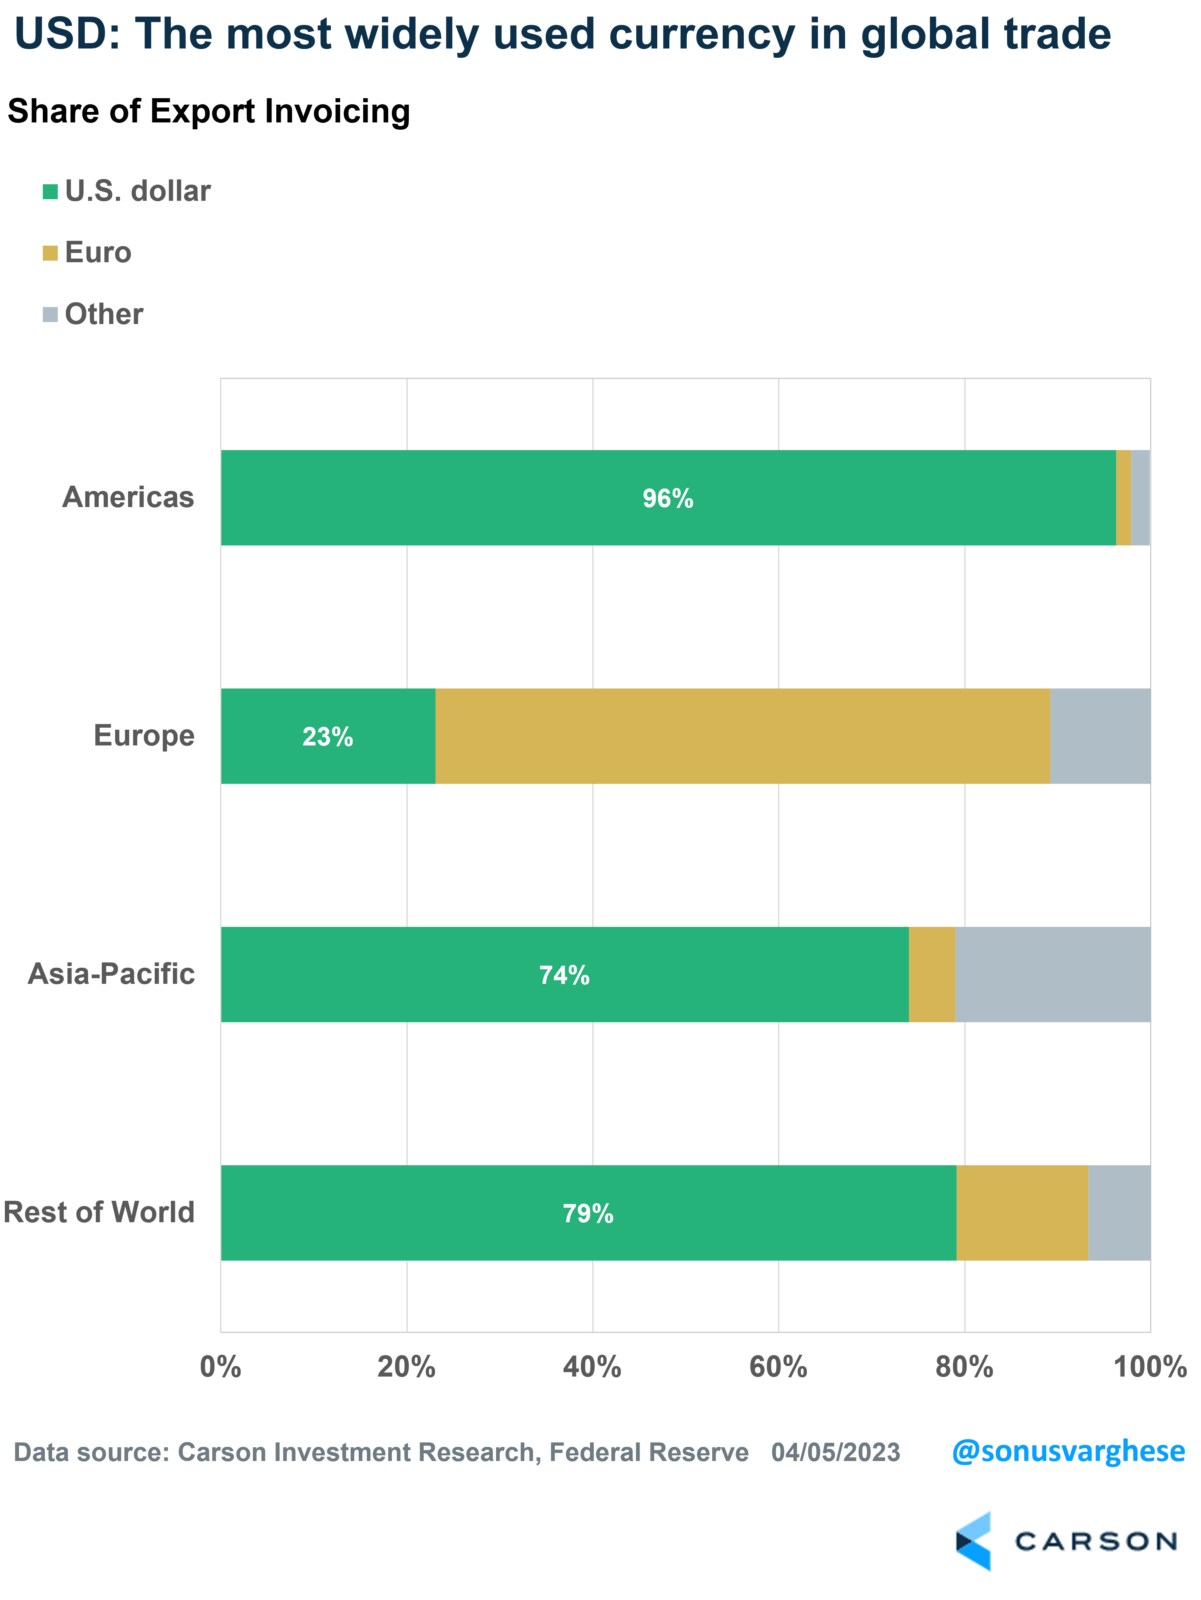
2. Network effects: The USD is dominant in trade invoicing and international finance
The USD is the world’s most popular medium of exchange when it comes to trade, even beyond North & South America. Outside of Europe, where the euro is naturally dominant, more than 70% of exports are invoiced in US dollars. That’s not likely to change anytime soon, especially with so many countries and companies involved.
(CLICK HERE FOR THE CHART!)
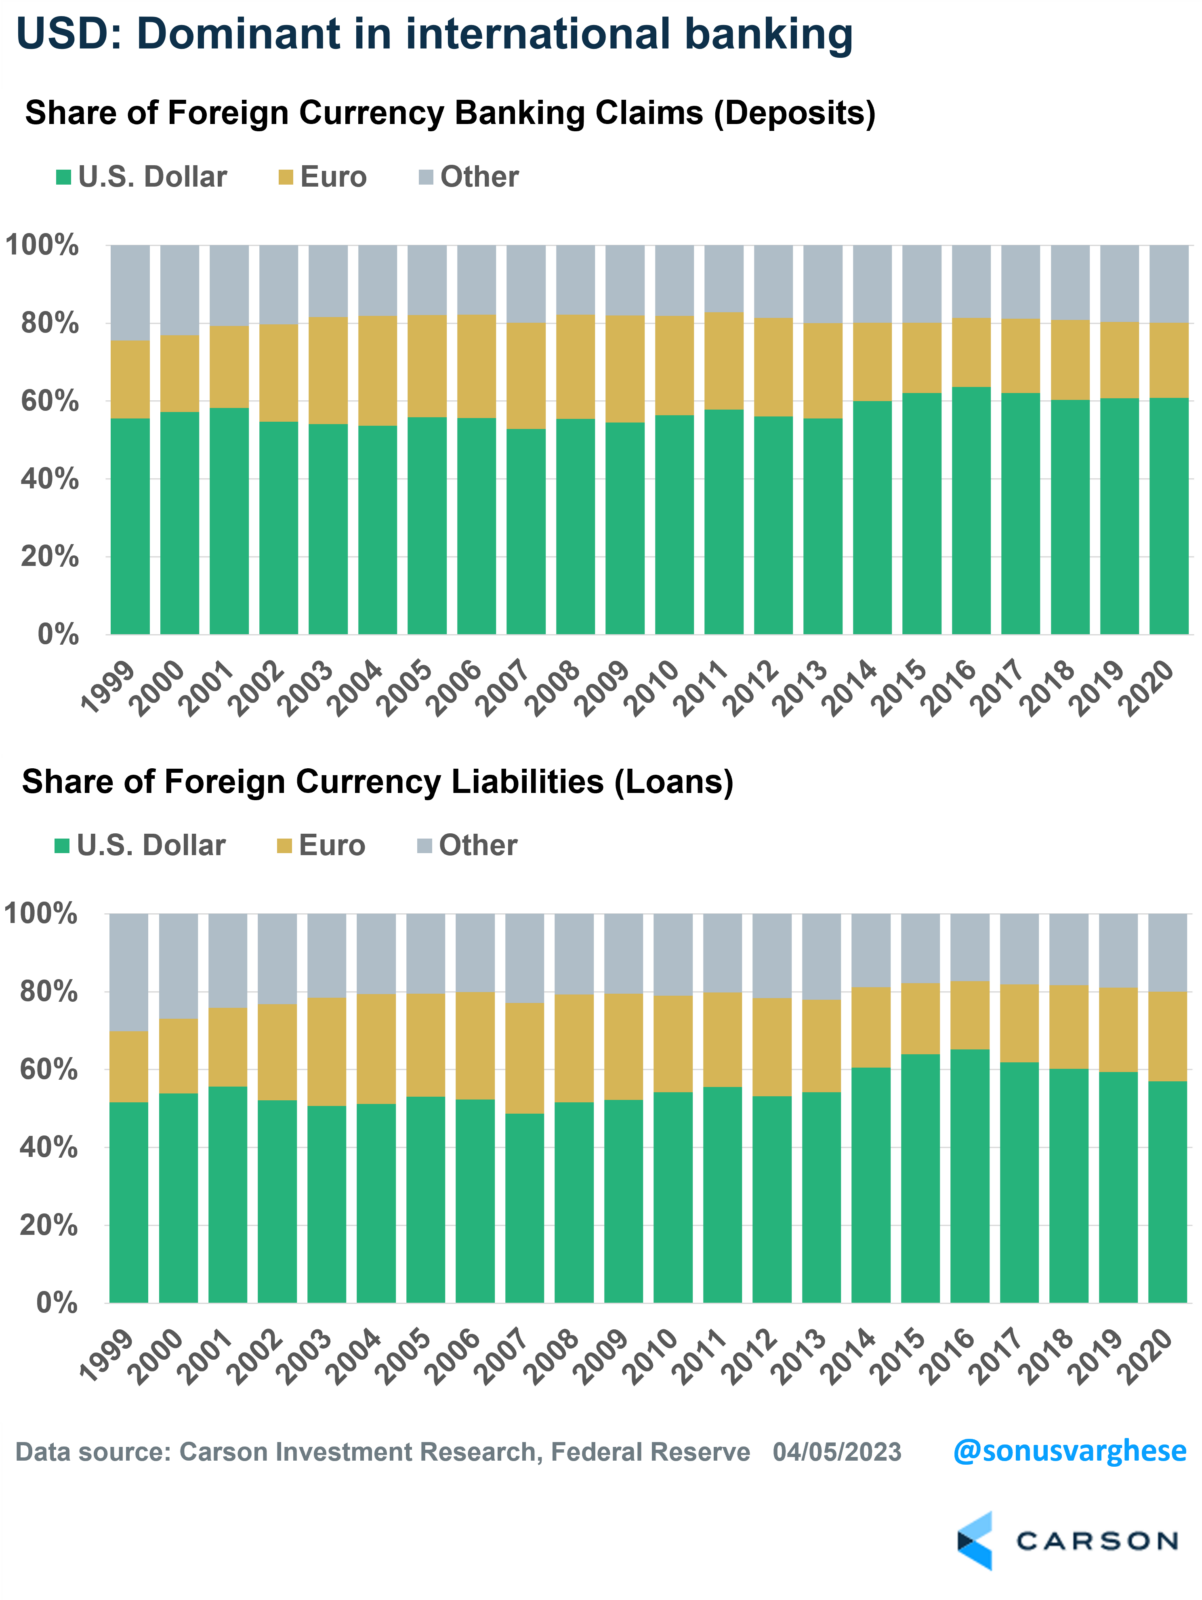
It shouldn’t be a surprise that the popularity of the USD as a medium of exchange means it almost automatically becomes the dominant currency in international banking. Think of all the USD flowing across global banks as companies/customers make payments to each other. 60% of international foreign currency banking claims, i.e., bank deposits denoted in foreign currency, and loans are USD. That’s been fairly stable since 2000 and has increased over the last few years. The euro is second but makes up just about 20%.
(CLICK HERE FOR THE CHART!)
Network effects can be extremely hard to dislodge. It won’t be easy to convince people across the world that they have to move their assets from the US dollar to another currency, let alone make the switch without any risk.
3. Most important reason is: The US is willing to maintain massive trade deficits
Here are a couple of statistics (as of Q4 2022)
The rest of the world held about $7.4 trillion in US treasury securities
The rest of the world held about $1 trillion in USD banknotes, which is about 46% of all USD banknotes out there
These are all “liabilities” of the US government, i.e., loans to the US government. But the real question is, why do foreigners hold so much of these in the first place?
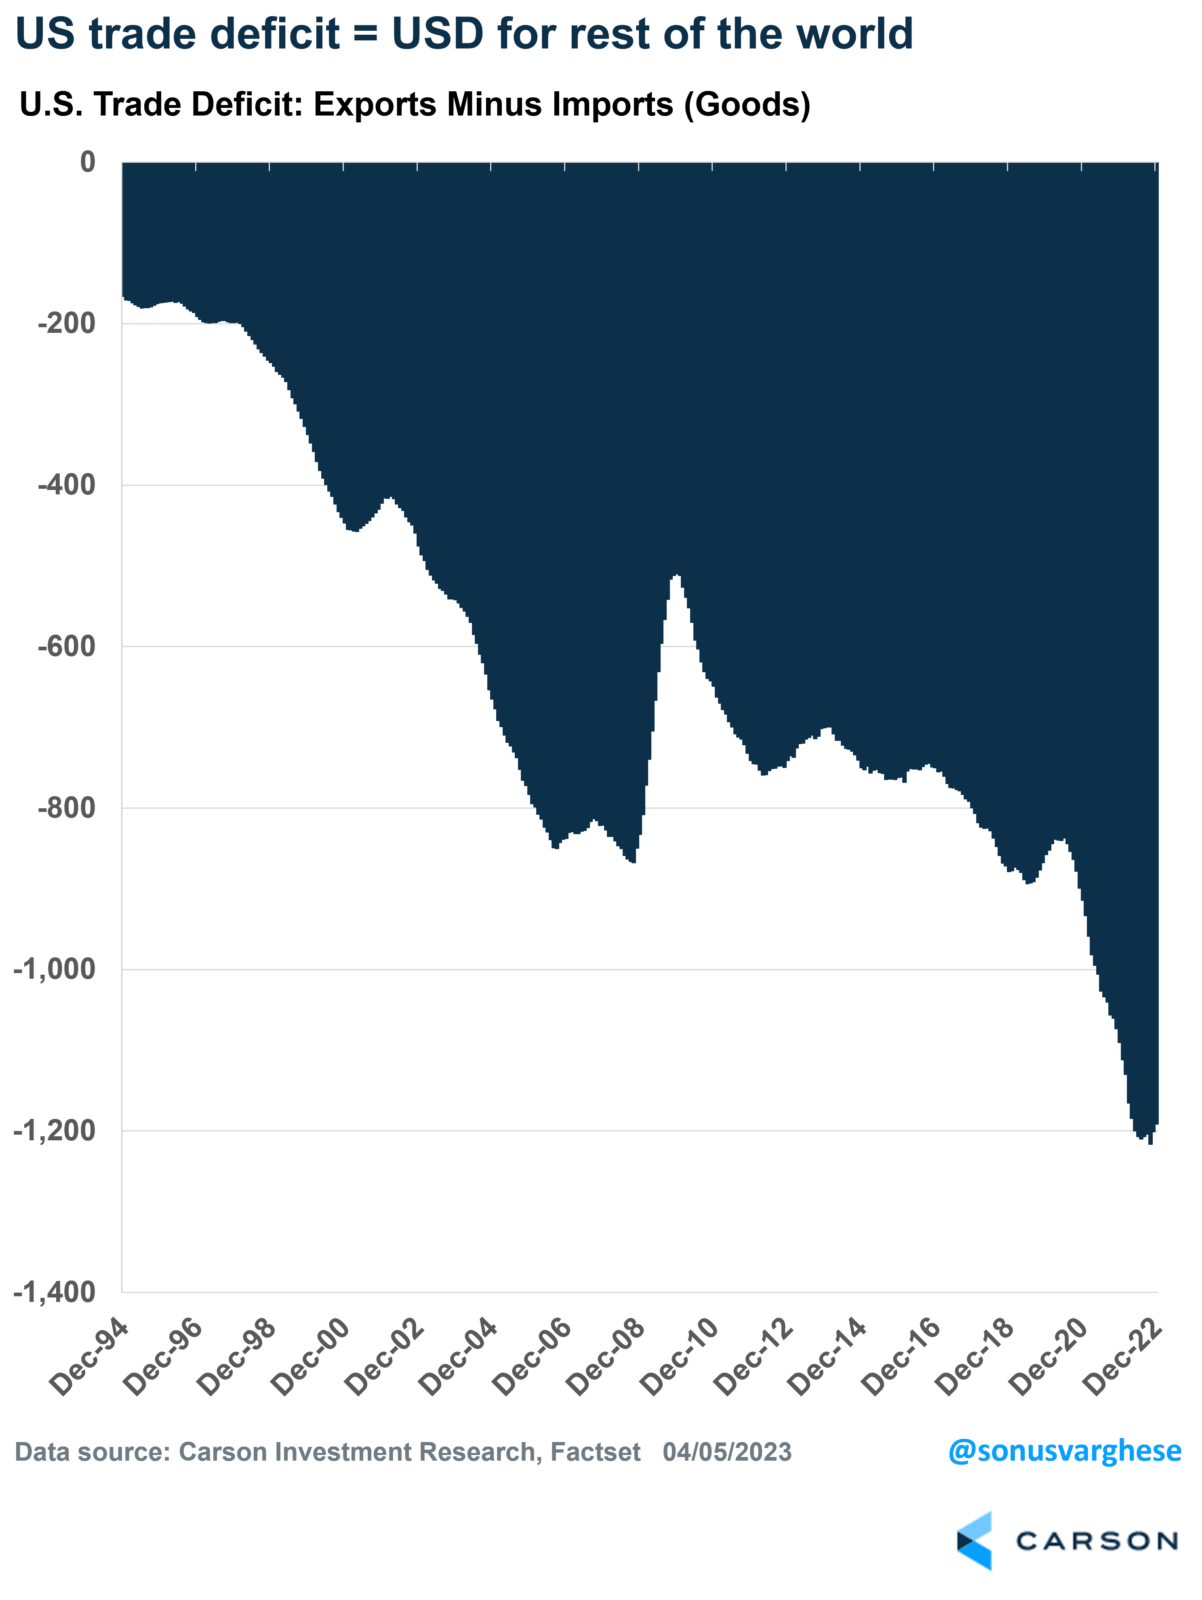
Part of the answer lies in the first two reasons, but here’s another big one. Foreigners sell a lot of stuff to Americans, about $3.3 trillion worth in 2022 alone. And they got USD in return for all that.
In an ideal world, foreigners would turn around and use those dollars to purchase stuff made in the USA, and trade would be “balanced”.
But they don’t. Instead, they bought about $2.1 trillion worth of goods from the US last year.
Which means there was an extra $1.2 trillion that foreigners had. What do they do with it?
(CLICK HERE FOR THE CHART!)
The US is willing to supply the rest of the world with treasuries & banknotes
U.S. dollars can only buy goods and financial assets in the US. Foreigners could buy something in Europe or China, but they’d have to convert the USD to euros/yuan first, and then someone else is left holding USD, and then they have to figure out what to do with those USD.
Instead, foreigners turn around and buy the safest, most liquid security in the world: US treasuries. Some of them also simply hold USD in cash (or deposits in their local bank). As I noted above, these are liabilities of the US government that the US is more than willing to issue. No other country, including the Eurozone, looks remotely capable or willing to do that anytime soon.
Which is why there are so many dollars and treasuries held by the rest of the world.
Could that change as countries decide to trade in their own currencies instead of the USD? Sure, but there’s a problem.
Take Saudi Arabia and China, for example. The former could sell oil to China in yuan, but then the Saudis have to figure out what to do with those yuan. They’d have to buy assets in China – but there aren’t too many of that, especially Chinese government bonds.
China has capital controls as well. which means it may not be easy for the Saudis to pull their money out of China in the future, especially during a crisis when the Chinese want to limit outflows. Capital controls are how the Chinese control their currency, and it’s hard to see them letting go of that lever anytime soon.
In sharp contrast, the Fed is willing to act as the global central bank, supplying dollar liquidity to the rest of the world when there’s a crisis.
The global economic model is unlikely to shift
The Chinese could decide they don’t want extra dollars. So instead of selling all the extra stuff they produce to Americans, they could sell it to Europe, the rest of Asia, and Africa. But the thing is, those countries don’t want too many of those goods either – because consumption is not as big a part of their economies (like the US).
Now, the Chinese could decide not to produce as much, but that is not a recipe for economic success.
Ideally, their own citizens would buy all the extra stuff they produce. But here’s the problem: Chinese households don’t earn enough to buy all those extra goods, and they save a lot more than Americans. They have to since there’s nothing like Social Security or Medicare there. China then channels these savings into investment, which leads to a lot of buildings, infrastructure, and industrial production, which is what drives their economy.
The Chinese government could “fix this,” but that involves a significant shift in how their economy works – essentially redistributing national income away from the government and businesses to households. A massive political project that’s unlikely to happen anytime soon.
It’s not just the Chinese. It’s the Germans, too, along with countries like Taiwan and South Korea, all of whom are reliant on exports to drive their economies.
A shift away from the economic model that these countries are reliant on to a model that is consumption-led is very difficult. As the previous chart shows, its actually gotten worse over the last few years as US trade deficits grew even more.
In fact, it would be better for US manufacturers if other countries do switch their economic model. Because that would mean they could buy more stuff that’s made in the US. And trade would be more balanced.
In any case, there’s no practical alternative to the U.S. dollar right now, and its dominance is likely to remain in place.
Here are the most notable companies reporting earnings in this upcoming trading week ahead-
(T.B.A. THIS WEEKEND.)
(CLICK HERE FOR NEXT WEEK'S MOST NOTABLE EARNINGS RELEASES!)
(CLICK HERE FOR NEXT WEEK'S HIGHEST VOLATILITY EARNINGS RELEASES!)
(CLICK HERE FOR MONDAY'S PRE-MARKET NOTABLE EARNINGS RELEASES!)
(CLICK HERE FOR THE MOST NOTABLE EARNINGS RELEASES FOR THE NEXT 2 WEEKS!)
(T.B.A. THIS WEEKEND.)
(T.B.A. THIS WEEKEND.) (T.B.A. THIS WEEKEND.).
(CLICK HERE FOR THE CHART!)
DISCUSS!
What are you all watching for in this upcoming trading week?
I hope you all have a wonderful 3-day weekend and a great trading week ahead r/stocks. 🙂
Leave a Reply