Good Thursday evening to all of you here on r/stocks! I hope everyone on this sub made out pretty nicely in the market this past week, and are ready for the new trading week ahead. 🙂
Here is everything you need to know to get you ready for the trading week beginning April 18th, 2022.
Stocks could stay choppy as fears about the Fed overshadow earnings news – (Source)
Earnings season is here, and it may distract investors from other issues, but it’s not likely to be the big driver of the overall market in the week ahead.
Investors instead will keep an eye on the things that have been worrying the market — interest rates, inflation and war in Ukraine — and they will be sifting through company commentaries to see how these things are impacting the bottom line.
A highlight of the week should be Thursday’s International Monetary Fund panel, which includes Federal Reserve Chair Jerome Powell and European Central Bank President Christine Lagarde, among others. The panel is a debate on the global economy and is to be moderated by CNBC’s Sara Eisen.
There are just a few economic reports, with several focused on housing. The National Association of Home Builders’ survey is released Monday. Housing starts are reported Tuesday, and existing home sales are Wednesday. The Philadelphia Fed manufacturing survey is released Thursday, and manufacturing and services PMI surveys are issued Friday.
“I think the market is so focused on the Fed and inflation and everything else that stocks will have a very weak response to earnings,” said Jonathan Golub, chief U.S. equity strategist at Credit Suisse. “I think the market is going to trade up, but the market is not going to give companies full credit.”
Seven Dow blue chips report earnings next week, including IBM, Procter and Gamble, Travelers, Dow Inc, Johnson and Johnson, American Express and Verizon. Netflix reports Tuesday and Tesla reports Wednesday, both after the bell. Snap reports Thursday.
Bank earnings will continue to roll in with Bank of America and Bank of New York Mellon both reporting Monday. Transportation companies will also release their numbers, including trucking firms Knight-Swift Transportation and J.B. Hunt Transport. United Airlines, American Airlines and Alaska Air are also on the calendar, as are railroads CSX and Union Pacific.
“Guidance is going to continue to be poor. Companies are going to whine and complain about cost pressures, even when they’re going to report improved results,” Golub said. “I think that’s going to make it a little sloppier in terms of the price action.”
Strategists expect there could be more misses and fewer beats in the first quarter earnings season. Earnings are expected to increase by 6.3% for the first quarter, based on actual reports and estimates, according to I/B/E/S data from Refinitiv.
“I think you’re going to see a lot more differentiation and divergences,” said Keith Lerner, co-chief investment officer and chief market strategist at Truist. “I think you’re going to see companies that have managed well, and others that have profit pressures. You’re going to see more extremes, relative to broad-based strength over the past two years.”
Strategists expect the market to remain volatile, as the Federal Reserve prepares to raise interest rates again in early May and continue to tighten policy this year.
“Our broader view is we’re going to continue to be in this big, broader choppy range,” Lerner said. “The way I see it for the next couple of months, is no new highs, and no new lows.”
The S&P 500 was down about 1.5% for the week, as of Thursday afternoon.
Rising bond yields were weighing on the stock market this past week, and the 10-year Treasury yield made a rapid move up to a high of 2.83% Wednesday from 2.70% on the previous Friday. It was at 2.82% Thursday.
The big focus for the bond market will be Powell’s comments Thursday.
“I think Powell’s going to be hawkish. He’s going to emphasize that they’re going to hike, hike a bunch, do the balance sheet and get on with it,” said Michael Schumacher, director rates strategy at Wells Fargo.
Neutral on stocks
Lerner said uncertainty about the Fed is one reason he downgraded the stock market from attractive to neutral this past week. He also did it based on rising yields and the defensive positioning he sees in the stock market.
“Given the rise in yields, the comparative valuations are now in a place where stocks have historically had an average outperformance [versus bonds] of about 3.5%, rather than the double digits when yields are lower,” he said.
Lerner said defensive sectors like consumer staples, health care, energy and REITS have been outperforming.
“When you look at the more economically sensitive areas of the market — financials, transportation and home builders, they’re all lagging. That’s telling us the market is concerned about slower growth,” he said. “Our view is recession risk is still relatively low over the next year. However, this is telling you we’re more likely to have a slowdown in the economy. Part of that is the Fed and also the sticky inflation numbers.”
This past week saw the following moves in the S&P:
(CLICK HERE FOR THE FULL S&P TREE MAP FOR THE PAST WEEK!)
S&P Sectors for this past week:
(CLICK HERE FOR THE S&P SECTORS FOR THE PAST WEEK!)
Major Indices for this past week:
(CLICK HERE FOR THE MAJOR INDICES FOR THE PAST WEEK!)
Major Futures Markets as of Thursday's close:
(CLICK HERE FOR THE MAJOR FUTURES INDICES AS OF FRIDAY!)
Economic Calendar for the Week Ahead:
(CLICK HERE FOR THE FULL ECONOMIC CALENDAR FOR THE WEEK AHEAD!)
Percentage Changes for the Major Indices, WTD, MTD, QTD, YTD as of Friday's close:
(CLICK HERE FOR THE CHART!)
S&P Sectors for the Past Week:
(CLICK HERE FOR THE CHART!)
Major Indices Pullback/Correction Levels as of Thursday's close:
(CLICK HERE FOR THE CHART!)
Major Indices Rally Levels as of Thursday's close:
(CLICK HERE FOR THE CHART!)
Most Anticipated Earnings Releases for this week:
([CLICK HERE FOR THE CHART!]())
(T.B.A. THIS WEEKEND.)
Here are the upcoming IPO's for this week:
(CLICK HERE FOR THE CHART!)
Thursday's Stock Analyst Upgrades & Downgrades:
(CLICK HERE FOR THE CHART LINK #1!)
(CLICK HERE FOR THE CHART LINK #2!)
MACD End Best Six Months Seasonal Signal Triggered
Last week we issued our annual Best Six Months Seasonal MACD “Sell” signal to our newsletter subscribers (arrow in the chart). But it is not an all-out sell. It’s a neutral signal for us to reposition our portfolios and get more defensive for the weaker time of the year from May to October – which is weakest in midterm years.
We have been calling it a “Sell” signal for years, but we are reconsidering that now as we don’t sell everything outright. We do sell some positions, tighten up stops, limit new buying and rotate into more defensive positions in sectors that historically do better in the Worst Six Months May-October, but we do not sell everything and hold many core positions.
We have been warning about heightened volatility all year, since our 2022 Annual Forecast out last December. And that is expected to continue into Q2-Q3 as we have major headline risk from Ukraine, inflation, the new Fed rate hike cycle, and China’s zero-Covid policy lockdowns that continue to hamper and exacerbate persistent supply chain issues. We are not bears, but we are not bulls either – we are neutral
(CLICK HERE FOR THE CHART!)
Sell Passover. Exodus: Movement of Your Portfolio
Much like the ancient Hebrews’ exodus out of Egypt, springtime and the Passover holiday are often an excellent time of year to consider portfolio maneuvers and repositioning as the “Best Six Months” of the year November-April comes to a close. In years like 2022 when the “Best Six Months” are underperforming, it is often an indication that the “Worst Six Months” AKA the “Sell in May” period will also be weak.
Some may remember the old saying on the Street, “Buy Rosh Hashanah, Sell Yom Kippur.” Though it had a good record at one time, it stopped working in the middle of the last century. It still gets tossed around every autumn when the “high holidays” are on the minds of traders as many take off to observe the Jewish New Year and Day of Atonement.
The basis for the new pattern, “Sell Rosh Hashanah-Buy Yom Kippur-Sell Passover,” is that with many traders and investors busy with religious observance and family, positions are closed out and volume fades creating a buying vacuum. Actual stats on the most observed Hebrew holidays have been compiled in the table here.
We present the data back to 1971 and when the holiday falls on a weekend the prior market close is used. It’s no coincidence that Rosh Hashanah and Yom Kippur fall in September and/or October, two dangerous and opportune months. We then took it a step further and calculated the return from Yom Kippur to Passover, which conveniently occurs in March or April, right near the end of our “Best Six Months” strategy.
Perhaps it’s Talmudic wisdom but, selling stocks before the eight-day span of the high holidays has avoided many declines, especially during uncertain times. While being long Yom Kippur to Passover has produced 63.6% more advances, about half as many losses and average gains of 7.0%. From Passover to Yom Kippur DJIA averages just 1.9% and is littered with nasty declines.
(CLICK HERE FOR THE CHART!)
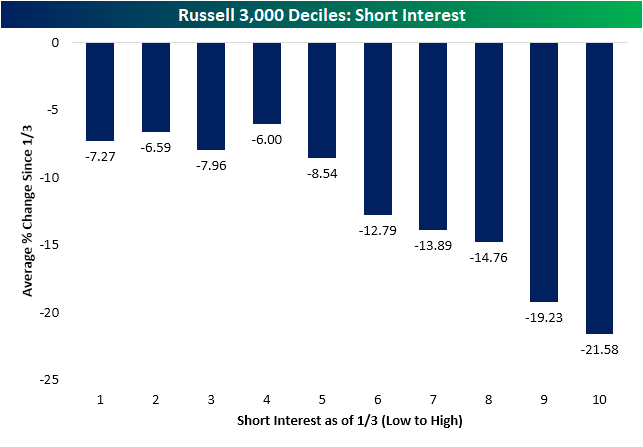
Short Interest Trade Mirrors Last Year
The first quarter of last year was marked by a period of massive short squeezes leading to outperformance of stocks with high levels of short interest. A little over one year later, the opposite has held true. As shown below, the stocks with the highest levels of short interest at the time of the last all time high on January 3rd have been the worst performers over the past few months. The decile of Russell 3,000 stocks with the highest levels of short interest at the start of the year have fallen 21.5% since January 3td while the first four deciles of stocks with the lowest levels of short interest have only fallen mid-single digits.
(CLICK HERE FOR THE CHART!)
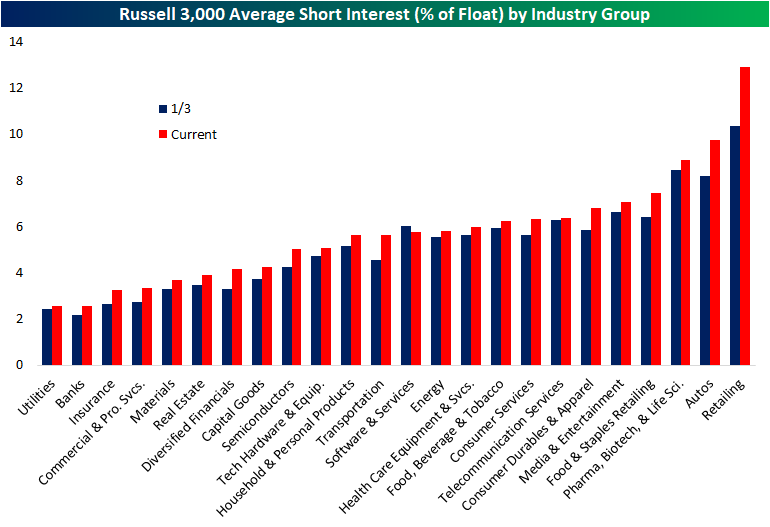
The latest update of short interest data through the end of March hit the tape earlier this week. The average level of short interest as a percent of float for all Russell 3,000 stocks fell sequentially from the mid-March update but with an average short interest reading of 5.78%, current readings are roughly half of one percentage point higher than at the start of the year.
Breaking it down by industry group, retail has seen the biggest increase in average short interest and now has the highest level of any industry group. Autos are the runner-up in both departments as short interest has climbed from 8.2% on January 3rd to 9.75% today. Utilities, Banks, Insurance, Commercial and Professional Services, Materials, and Real Estate, meanwhile, are on the other end of the spectrum as the only sectors with short interest as a percentage of float below 4%.
(CLICK HERE FOR THE CHART!)
Turning to individual stocks, Rent the Runway (RENT) now has the most elevated level of short interest as the only stock in the index with over half of its free-floating shares sold short. Conn's (CONN), however, comes close with 49.16% of its float sold short. Both stocks have seen sharp increases in bearish bets this year as those readings compare to 26.82% and 14.58%, respectively for RENT and CONN. Most of these heavily shorted names have been pain trades this year, but there are a small handful of exceptions. Gogo (GOGO) and Arch Resources (ARCH) have seen substantial rallies of 66.3% and 72.45%, respectively, as the broader market has pulled back. While not as strong of a performance, Dillard's (DDS) has also rallied solidly gaining 16%.
(CLICK HERE FOR THE CHART!
As previously mentioned, CONN finds itself near the top of the list of the most heavily shorted Russell 3,000 stocks, but it has been the one with the largest increase in short interest of the whole index since the January 3rd high. No other name has seen short interest rise by more than 30 percentage points in that time, but MedAvail (MDVL), Rent the Runway (RENT), and Frontier (ULCC) have seen readings rise over 20 percentage points.
(CLICK HERE FOR THE CHART!
Defensives Propping Up New Highs
The S&P 500 has fallen in four of the past five sessions continuing to pull back from its lower high, but surprisingly, the net percentage of the index hitting new 52-week highs actually saw one of the strongest readings of the year on Friday as we show in the chart from our Sector Snapshot below. To cap off last week, a net 11% of S&P 500 stocks were at new 52-week highs; the highest reading since January 5th which was only a couple of days after the index's last all-time high. Typically, we look at net new highs as a way to confirm moves in the broader market. In other words, it is viewed as better to see a larger number of stocks trading at new highs versus new lows. While net new highs are so far lower today, Fridays' double-digit positive reading was unusually high for a down day. Historically going back to 1990, the average net new high reading when the S&P 500 has been lower on the day has only been 1.6%. It was even a strong reading compared to the average for up days (4.77%) as well.
(CLICK HERE FOR THE CHART!)
As for how new highs have held up relatively well as the broader market has pulled back, defensive sectors—Consumer Staples, Health Care, Utilities, and Real Estate—are almost entirely the ones to thank. To illustrate this, below we show the daily percentage of S&P 500 stocks hitting new highs that are from one of the four defensive sectors just mentioned. There is plenty of precedent in the past several years for these four sectors to account for all of a day's new highs including several days in late January and early February. At the high last Wednesday, over 90% of S&P 500's new highs came from defensive sectors. On a 50-DMA basis, this reading is now at the highest level since the spring of 2020.
(CLICK HERE FOR THE CHART!)
In other words, defensives have been a notable pocket of strength recently. As for just how large of a run they have been on, in the charts below we show the rolling one month change of these sectors going back to 1990 (2001 for Real Estate). While the rates of change have peaked, Health Care and Utilities are up double digits in the past month while Consumer Staples and Real Estate have risen high single-digit percentage points. For all sectors except for Real Estate, those rallies rank in the top 3% of all monthly moves since 1990 and Real Estates is still in the top decile of all monthly moves going back to 2001.
(CLICK HERE FOR THE CHART!)
BABY's Back
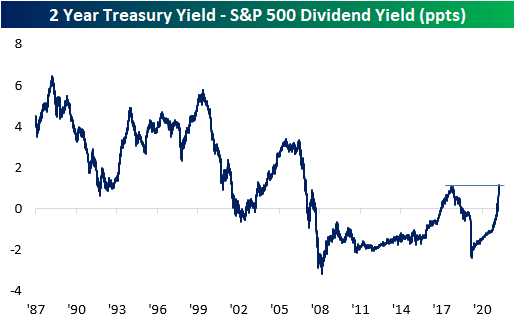
Since mid to late-2019 when interest rates really started to fall, the dividend yield on the S&P 500 consistently provided a higher yield than the two-year US Treasury. With a higher payout plus the potential for price appreciation, equities looked more attractive to many investors. The period from the Financial Crisis through 2017 also saw a similar setup where the S&P 500's dividend yield was higher than the yield on the 2-year, but before the Financial Crisis and the FOMC's zero-interest-rate policy, it was extremely uncommon for the S&P 500 to yield more than the two-year Treasury. This year has caused a tidal shift in the balance of power in yield between the S&P 500 and the two-year Treasury. As the Fed came to the conclusion that inflation wasn't as transitory as originally thought and found itself behind the inflation curve, it shifted from a much more accommodative stance to one that was more biased towards tightening, and that shift resulted in one of the most rapid increases in two-year Treasury yields in decades. In the process of this spike in rates, back in February, the yield on the two-year rose back above the dividend yield of the S&P 500 for the first time since 2019.
(CLICK HERE FOR THE CHART!)
As Treasury yields have continued to spike, the premium in yield of two-year Treasuries relative to the dividend yield of the S&P 500 reached an important milestone last Friday (4/8). As shown in the chart below, the spread between their yields widened out to 110 basis points (bps), taking out the high of 108 bps from 2018. At these levels, the spread between the two is now the widest it has been in fourteen years since the Financial Crisis. It started with long-term Treasury yields, but as the overall trend in rates has been higher, most of the Treasury yield curve is now yielding more than the S&P 500. For years now, investors have had a TINA (There Is No Alternative) relationship with the stock market, but as interest rates have shot higher, TINA is taking a backseat to BABY (Bonds Are Better Yielders).
(CLICK HERE FOR THE CHART!)
Potential Sector Winners and Losers This Earnings Season
Earnings season unofficially got underway yesterday with results from Blackrock, JPMorgan Chase, and Delta Airlines. The results were mixed, with JPMorgan Chase shares selling off on the results amid a sizable Russia-related writedown, Blackrock shares little changed, and Delta shares up 6% on its results.
Delta’s results are encouraging for the travel sector, though we would be careful to translate the news over to the very broad industrials sector and is further along in its recovery while facing a wide range of economic challenges.
The cool reception to financial services results on Wednesday may foretell what will be a challenging quarter. “Financial services companies, particularly the big global banks, faced a number of challenges in the first quarter,” noted LPL Financial Equity Strategist Jeffrey Buchbinder. “The flattening yield curve, Russian sanctions, and a difficult year-over-year comparison after significant loan loss reserve releases in the first quarter of 2021 almost certainly set the stage for lower earnings.”
As shown in the LPL Financial Chart of the Day, energy sector earnings will likely produce by far the strongest earnings growth in the quarter. But on the other end of the spectrum, financials earnings are expected to see a significant annual decline.
(CLICK HERE FOR THE CHART!)
The aforementioned macroeconomic challenges coupled with this expected earnings decline were among the reasons LPL Research’s Strategic and Tactical Asset Allocation Committtee (STAAC) downgraded its financials sector view to neutral earlier this month despite relatively attractive valuations. The sector has also experienced price weakness that, from a technical analysis perspective, the Committee thinks may signal continued near-term underperformance. Finally, negative earnings revisions in the month leading up to earnings season, shown in the chart below, suggest some caution is prudent ahead of reporting season, in our view.
(CLICK HERE FOR THE CHART!)
The STAAC also downgraded views of industrials and consumer discretionary to negative this month, a stance certainly supported by recent earnings revisions. Those two sectors are generally hurt by high energy costs, Russian sanctions, the China lockdowns, and ongoing supply chain disruptions.
So what sector might be winner this earnings season? The obvious answer is the natural resource sectors, i.e., energy and materials. But perhaps less obvious, we think utilities will be able to grow earnings double-digits. STAAC upgraded its utilities view to neutral this month. The sector may benefit from energy sensitivity and is less exposed to a potential slowdown in the economy.
STAAC’s view of healthcare, another potential earnings winner, is positive. Healthcare quietly generated a 7 percentage point upside surprise to earnings last quarter, is a reopening beneficiary, is relatively less economically sensitive, and is more insulated from supply chain issues and slower growth overseas than the cyclical sectors.
Finally, don’t fall asleep on technology. Our view of the sector is still just neutral but double-digit earnings growth in the first quarter looks likely, while estimates have held up well over the past month despite the global economic slowdown.
Here are the most notable companies reporting earnings in this upcoming trading week ahead-
- (T.B.A. THIS WEEKEND.)
([CLICK HERE FOR NEXT WEEK'S MOST NOTABLE EARNINGS RELEASES!]())
(T.B.A. THIS WEEKEND.)
([CLICK HERE FOR NEXT WEEK'S HIGHEST VOLATILITY EARNINGS RELEASES!]())
(T.B.A. THIS WEEKEND.)
Below are some of the notable companies coming out with earnings releases this upcoming trading week ahead which includes the date/time of release & consensus estimates courtesy of Earnings Whispers:
Monday 4.18.22 Before Market Open:
(CLICK HERE FOR MONDAY'S PRE-MARKET EARNINGS TIME & ESTIMATES!)
Monday 4.18.22 After Market Close:
(CLICK HERE FOR MONDAY'S AFTER-MARKET EARNINGS TIME & ESTIMATES!)
Tuesday 4.19.22 Before Market Open:
(CLICK HERE FOR TUESDAY'S PRE-MARKET EARNINGS TIME & ESTIMATES!)
Tuesday 4.19.22 After Market Close:
(CLICK HERE FOR TUESDAY'S AFTER-MARKET EARNINGS TIME & ESTIMATES!)
Wednesday 4.20.22 Before Market Open:
(CLICK HERE FOR WEDNESDAY'S PRE-MARKET EARNINGS TIME & ESTIMATES!)
Wednesday 4.20.22 After Market Close:
(CLICK HERE FOR WEDNESDAY'S AFTER-MARKET EARNINGS TIME & ESTIMATES!)
Thursday 4.21.22 Before Market Open:
(CLICK HERE FOR THURSDAY'S PRE-MARKET EARNINGS TIME & ESTIMATES!)
Thursday 4.21.22 After Market Close:
(CLICK HERE FOR THURSDAY'S AFTER-MARKET EARNINGS TIME & ESTIMATES!)
Friday 4.22.22 Before Market Open:
(CLICK HERE FOR FRIDAY'S PRE-MARKET EARNINGS TIME & ESTIMATES LINK!)
Friday 4.22.22 After Market Close:
([CLICK HERE FOR FRIDAY'S AFTER-MARKET EARNINGS TIME & ESTIMATES!]())
(NONE.)
(T.B.A. THIS WEEKEND.)
(T.B.A. THIS WEEKEND.) (T.B.A. THIS WEEKEND.).
(CLICK HERE FOR THE CHART!)
DISCUSS!
What are you all watching for in this upcoming holiday-shortened trading week?
I hope you all have a wonderful Easter weekend and a great trading week ahead r/stocks. 🙂
Leave a Reply