Good Friday evening to all of you here on r/stocks! I hope everyone on this sub made out pretty nicely in the market this past week, and are ready for the new trading week ahead. 🙂
Here is everything you need to know to get you ready for the trading week beginning July 31st, 2023.
S&P 500 closes nearly 1% higher on softening inflation data, nabs 3rd week of gains: Live updates – (Source)
Stocks rose Friday with the Dow Jones Industrial Average and S&P 500 closing out their third winning weeks in a row as a measure of inflation closely watched by the Federal Reserve came in at its lowest in nearly two years.
The Dow jumped 176.57 points, or 0.50%, to 35,459.29. The S&P 500 added 0.99% to 4,582.23. The Nasdaq Composite gained 1.90% to 14,316.66.
All three major averages notched weekly gains with the 30-stock average up by about 0.66%. On Thursday, the Dow ended a 13-day win streak, a length not seen since 1987. The S&P advanced 1.01%, and the tech-heavy index is up 2.02%.
This week, investors cheered data showing cooling inflation and stronger-than-expected earnings reports that supported the case the U.S. could avoid a recession.
On Friday, June data for the personal consumption expenditures price index continued to show easing inflation. The gauge showed core PCE gained 0.2% month-over-month, in line with the 0.2% increase expected by economists polled by Dow Jones. Core PCE rose 4.1% from the year-ago period, lower than the anticipated 4.2%.
The data is of particular interest after the central bank raised interest rates earlier this week in a widely expected move. The Fed targets inflation at 2% annually.
“In the wake of stronger than expected GDP, and a better-than-expected earnings season, this could be the catalyst to send the market to new highs,” wrote Gina Bolvin, president of Bolvin Wealth Management Group.
Earnings season continued with Dow member Procter & Gamble shares gaining nearly 3%. The consumer goods company behind Tide and other brands beat analysts’ earnings and revenue expectations in its most recent quarter.
Intel jumped 6.6% as investors applauded a return to profitability, while Roku climbed 31% a day after beating Wall Street expectations on both the top and bottom lines.
On the other hand, Ford Motor shares fell 3.4% even though the automaker beat estimates and raised guidance. The company said its electric vehicle adoption was taking longer than expected due to higher costs.
This past week saw the following moves in the S&P:
(CLICK HERE FOR THE FULL S&P TREE MAP FOR THE PAST WEEK!)
S&P Sectors for this past week:
(CLICK HERE FOR THE S&P SECTORS FOR THE PAST WEEK!)
Major Indices for this past week:
(CLICK HERE FOR THE MAJOR INDICES FOR THE PAST WEEK!)
Major Futures Markets as of Friday's close:
(CLICK HERE FOR THE MAJOR FUTURES INDICES AS OF FRIDAY!)
Economic Calendar for the Week Ahead:
(CLICK HERE FOR THE FULL ECONOMIC CALENDAR FOR THE WEEK AHEAD!)
Percentage Changes for the Major Indices, WTD, MTD, QTD, YTD as of Friday's close:
(CLICK HERE FOR THE CHART!)
S&P Sectors for the Past Week:
(CLICK HERE FOR THE CHART!)
Major Indices Pullback/Correction Levels as of Friday's close:
(CLICK HERE FOR THE CHART!
Major Indices Rally Levels as of Friday's close:
(CLICK HERE FOR THE CHART!)
Most Anticipated Earnings Releases for this week:
(CLICK HERE FOR THE CHART!)
Here are the upcoming IPO's for this week:
(CLICK HERE FOR THE CHART!)
Friday's Stock Analyst Upgrades & Downgrades:
(CLICK HERE FOR THE CHART LINK #1!)
(CLICK HERE FOR THE CHART LINK #2!)
Sentiment Staying Bullish
The S&P 500 has continued its rally but sentiment has not exactly reflected that. The latest reading on investor sentiment from the AAII survey showed bullish sentiment dropped back below 50% this week. 44.5% of respondents reported as bullish in the past week which is right in line with the average reading of the past two months.
(CLICK HERE FOR THE CHART!)
The 6.5-point decline in bulls was only partially picked up by bearish sentiment which rose from 21.5% (the lowest level in over two years) to 24.1%. Albeit higher sequentially, that remains a muted reading.
(CLICK HERE FOR THE CHART!)
Neutral sentiment took home a larger share of the drop to bulls with the reading rising to 31% from 27.1%. That is only the most elevated reading in two weeks as neutral sentiment is the closest of any response to its respective historical average.
(CLICK HERE FOR THE CHART!)
While the AAII survey showed some moderation in optimism this week, that was not the case for other surveys. In last Thursday's Closer, we discussed how alongside the AAII survey, multiple other sentiment readings have tipped in favor of bulls recently. One such indicator that has continued to become more bullish is the NAAIM Exposure index which tracks the average equity exposure of active investment managers. Readings range from -200 to +200. -200/+200 would imply on average money managers are leveraged short/long, readings of -100/+100 would be fully short/long, and a reading of zero would be market neutral. This week the index tipped above 100 for the first time since late November 2021. In other words, active money managers are now fully long for the first time in over a year and a half. That streak of readings below 100 also ends as the fourth longest in the survey's history at 86 weeks in a row.
(CLICK HERE FOR THE CHART!)
Jobless Claims Back to Improving
It was a solid morning for economic data with a number of indicators coming in better than expected. Weekly jobless claims were one of those with seasonally adjusted initial claims unexpectedly falling to 221K from 228K last week and the lowest level since the second half of February.
(CLICK HERE FOR THE CHART!)
Before seasonal adjustment, claims fell significantly week over week as could be expected for this point of the year. The 44.5K drop this week was in line with the average historical drop for the current week of the year as claims have fallen 80% of the time. Going forward, there will continue to be seasonal tailwinds through the end of summer before the typical fourth quarter turn higher.
(CLICK HERE FOR THE CHART!)
As for continuing claims, the seasonally adjusted reading likewise hit a new short-term low coming in at just 1.69 million. That is the lowest reading and first sub-1.7 million since the end of January. Combined with the initial claims reading, this recent data points to a return to strength in the labor market data following deterioration late last year through the early spring.
(CLICK HERE FOR THE CHART!)
Where the Jobs Were
In last night's Closer, we discussed the latest job postings data from job listings website Indeed. Compared to the official reading on labor market demand — the Job Openings and Labor Turnover Survey (JOLTS) — which is released monthly at a two-month lag, this Indeed data is a daily look with much lower latency. The latest release as of Tuesday covers postings through July 21st. As shown below, postings remain in a downtrend in spite of a modest rebound in the latest month. Having tracked well with the official data, modeling JOLTS on the Indeed data would predict JOLTS to continue to fall to around 9.57 million for the June data scheduled to be released next week.
(CLICK HERE FOR THE CHART!)
The Indeed data also provides a good deal of demographic granularity based upon geographic areas. As shown below, the first two years of the pandemic had been a boon for smaller metro areas as they generally saw healthier readings on postings than the largest cities. While that dynamic moderated through the back half of 2021 through early 2022, the past year has seen the trend return. As shown in the charts below, postings have fallen regardless of MSA size, but larger metros have experienced a much more substantial drop. The smallest metros, on the other hand, have seen a much more modest decline, especially over the past several months. Check out the big drop in the second chart below showing the spread between the largest and smallest metros:
(CLICK HERE FOR THE CHART!)
The data also provides a breakdown based on job industry. In the table below, we show the change in each industries' postings since the pre-pandemic baseline of early February 2020. Currently, there are six groups with a lower reading on postings versus pre-pandemic: IT Operations & Helpdesk, Media & Communications, Marketing, Information Documentation and Design, Software Development, and Mathematics. Meanwhile, several health care and engineering related roles continue to sit atop the list with the greatest post-pandemic growth in job postings. Finally, we would also note that some industries like Human Resources and logistics-related industries that saw postings boom on account of strong hiring and stressed supply chains have moderated. Today, those same indices now have postings that are middle of the pack at best.
(CLICK HERE FOR THE CHART!)
Emerging Markets (EEM) Attempts a Break Out
Today we published our most recent Global Macro Dashboard which provides a high level summary of 22 major economies. Taking a look at those same countries' stock markets via US traded ETFs, 2023 has seen broad rebounds in equity prices across the globe. At the moment, the average country ETF is 4.55% away from a 52-week high after posting a double-digit YTD gain. Based on developed and emerging countries, there has been some divergence. Both last year and again this year, emerging market equities have seen modest outperformance relative to developed markets. That has also been the case in July with an average gain of 5.24% for EM countries versus a 2.85% rise for their developed market peers. South Africa (EZA) is up the most month-to-date with a 10.2% gain, while France (EWQ) is up the least with a gain of just 13 bps so far in July.
(CLICK HERE FOR THE CHART!)
From a technical perspective, the gains in emerging markets—proxied by the iShares MSCI Emerging Markets ETF (EEM)—have resulted in a move above resistance at some of the past year's highs. As shown below, earlier in the spring and again only a couple of weeks ago, EEM attempted to retest the levels from last summer unsuccessfully. Today, EEM is back above those levels with the next resistance to watch being the January high at $42.50.
(CLICK HERE FOR THE CHART!)
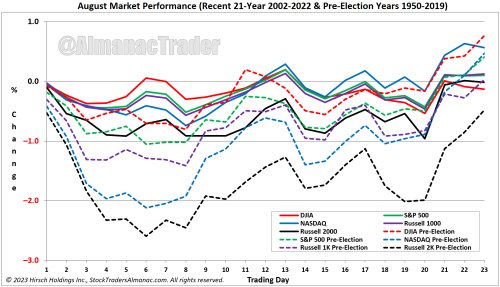
1st 8 or 9 Days of August Weaker Pre-Election Years
(CLICK HERE FOR THE CHART!)
First eight or nine trading days of August have exhibited weakness while mid-month has been better. This pattern holds in pre-election years with greater magnitude (dashed lines). Note the bullish cluster from August 15 through 17. This strength is visible above on trading days 11, 12 and 13. The end of August tends to be softer when traders evacuate Wall Street for a summer finale. The last five days were generally bearish from 1996 to 2013 but have been positive in seven of the last nine years. In 2022, S&P 500 dropped 4.5% in the last five trading days of August. S&P 500 has also only been up nine times on the penultimate day of August in the past 27 years.
Most Confident Consumers in Two Years
In case you didn't see it already, today's report on Consumer Confidence from the Conference Board showed that consumers are more confident than they have been at any point in the last two years. While there are still no shortage of negative macro headlines, with employment remaining strong, inflation easing, and the stock market in a bull market, you can't fault consumers for being more confident than they have been in recent history.
For some perspective on the current levels of consumer sentiment, the chart below shows historical readings of Consumer Confidence with red dots showing each time that the monthly reading made a new two-year high. As you can see, these types of readings aren't rare, especially during prolonged economic expansions, and as a corollary to the saying that it's often darkest before the dawn, sentiment tends to be brightest right up until sunset.
(CLICK HERE FOR THE CHART!)
In each of the prior periods where sentiment hit a two-year high just before the economy started to roll over, it was preceded by multiple occurrences of sentiment hitting new two-year highs. If we further filter out occurrences for periods when sentiment hit a two-year high for the first time in at least a year, the picture looks a lot different. In this case, there was never an occurrence just as the economy was on the verge of a recession, and most of them tended to occur early in the cycle rather than late. Interestingly enough, with all the debate over whether or not the economy is in a recession or not, the pattern of Consumer Confidence in the current period looks very much similar to the pattern during the double-dip recession of the early 1980s. Like the current period, back then there was a sharp drop and subsequent sharp rebound in confidence followed by another decline that failed to make a lower low. The only difference this time around is that following the initial COVID recession of 2020 there wasn't another recession in the next two years- at least not an officially declared recession.
(CLICK HERE FOR THE CHART!)
August Can Be Challenging in Pre-Election Years
Money flows from harvesting made August a great stock market month in the first half of the Twentieth Century. It was the best > DJIA month from 1901 to 1951. Now it is the worst DJIA and second worst S&P 500, NASDAQ, Russell 1000, and Russell 2000 month over the last 35 years, 1988-2022 with average performance ranging from 0.1% by NASDAQ to a –0.9% loss by DJIA. Last year, DJIA, S&P 500, NASDAQ, and Russell 1000 all declined over 4% in August.
Contributing to this poor performance since 1988; the second shortest bear market in history (45 days) caused by turmoil in Russia, the Asian currency crisis and the Long-Term Capital Management hedge fund debacle ending August 31, 1998, with the DJIA shedding 6.4% that day. DJIA dropped 1344.22 points for the month, off 15.1%—which is the second worst monthly percentage DJIA loss since 1950. Saddam Hussein triggered a 10.0% slide in August 1990. The best DJIA gains occurred in 1982 (11.5%) and 1984 (9.8%) as bear markets ended. Sizeable losses in 2010, 2011, 2013, 2015 and 2022 of over 4% by DJIA have widened its August average decline.
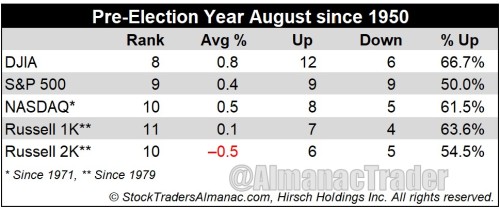
In pre-election years since 1950, Augusts’ rankings improve modestly: #8 DJIA, #9 S&P 500, #10 NASDAQ (since 1971), #11 Russell 1000 and #10 Russell 2000 (since 1979). Average performance in pre-election years is positive except for Russell 2000. However, all five indexes have declined in August during the last three pre-election years, 2019, 2015 and 2011. It would appear, August’s pre-election year advantage is fading.
(CLICK HERE FOR THE CHART!)
Here is the list of notable companies reporting earnings in this upcoming trading week ahead-
(T.B.A. THIS WEEKEND.)
(CLICK HERE FOR NEXT WEEK'S MOST NOTABLE EARNINGS RELEASES!)
([CLICK HERE FOR NEXT WEEK'S HIGHEST VOLATILITY EARNINGS RELEASES!]())
(T.B.A. THIS WEEKEND.)
(CLICK HERE FOR MONDAY'S PRE-MARKET NOTABLE EARNINGS RELEASES!)
DISCUSS!
What are you all watching for in this upcoming trading week?
I hope you all have a wonderful weekend and an awesome trading week ahead r/stocks. 🙂
Leave a Reply