Good Friday evening to all of you here on r/stocks! I hope everyone on this sub made out pretty nicely in the market this past week, and are ready for the new trading week ahead. 🙂
Here is everything you need to know to get you ready for the trading week beginning March 7th, 2022.
Russia’s Ukraine conflict, big inflation report will keep the stock market volatile in coming week – (Source)
Federal Reserve Chair Jerome Powell testifies before Congress in the week ahead, and markets will hang on what he says regarding how the Russia-Ukraine conflict could affect Fed policy.
Russia’s invasion of Ukraine will continue to be a major focus, as wary investors watch fresh inflation data and the rising price of oil in the week ahead.
Stocks in the past week sold off in volatile trading, as oil rose more than 20% and a whole host of other commodities rose on supply worries. Investors sought safety in bonds, driving prices higher and the 10-year Treasury yield to 1.72% Friday. The dollar rallied, pushing the dollar index up 2% on the week.
“We just don’t know what can happen over the weekend. It looks like the Russians are amping themselves up and they’re getting more aggressive,” said Jim Caron, Morgan Stanley Investment Management head of macro strategies for global fixed income.
“If nothing happens over the weekend, or if there’s some peace talks coming, then the 10-year note yield could go up 10 to 15 basis points. It could have that swing,” said Caron. Yields move opposite price. (1 basis point equals 0.01%.)
The Federal Reserve will also be top of mind, as investors focus on its pending interest rate hike on March 16. But Fed officials will not be making public addresses in the quiet period leading up to their meeting.
The economic calendar is relatively light in the coming week, with the exception of Thursday’s report of February’s consumer price index.
According to Dow Jones, economists expect headline inflation to rise to 7.8% year-over-year, from 7.5% in January, the highest since 1982. Headline inflation includes food and energy prices.
“The risk is to the upside. It will be a shocker if we get an 8% handle,” said Marc Chandler, chief market strategist at Bannockburn Global Forex.
Investors will also focus on how the market itself is trading. The S&P 500 fell 1.3% to 4,328 in the past week, while the Nasdaq lost 2.8% to 13,313.
“The major averages are all in a downtrend here. They seem to rally and then run out of steam,” said Paul Hickey, co-founder of Bespoke. “Until you get some kind of break of that, you want to be a little cautious. It’s definitely concerning, all this stuff.”
Hickey said that the market is behaving similarly as it did in other conflicts.
“In the short run, there’s a lot of uncertainty,” said Hickey “I think the playbook is similar. You tend to see a lot of sloshing around – big swings up and down — and then eventually things start to stabilize a few months later…The question is where does this one go?”
Boiling oil
Following a week of gains, oil jumped sharply again Friday, with West Texas Intermediate rising above $115 for the first time since 2008. WTI rose 7.4% Friday and was up 26% for the week, to settle at $115.68. Russia’s battle for control of Europe’s largest nuclear power plant early Friday spooked investors.
The Russian invasion of Ukraine has stirred up more fear of inflation, and economists are already raising their inflation forecasts, due to rising oil prices. The whole commodities complex has shifted higher, since Russia is such a key producer of wheat, palladium, aluminum and other commodities.
Rising oil prices can be a worry since they can generate one of the biggest hits to inflation and do so quickly.
Russia is unique in that it is a very large commodity exporter and has the ability to impact many markets. It is one of the world’s largest exporters of crude and natural gas, with its primary customer Europe. It is the largest exporter of both palladium and wheat.
The jump in oil has already been hitting U.S. consumers at the pump. Gasoline prices were $3.83 per gallon of unleaded Friday, up 11 cents in just a day and 26 cents in a week, according to AAA.
“The national average could get to $4 a gallon next week,” said John Kilduff, partner with Again Capital.
In the oil market, Kilduff said there was brisk buying Friday. “There’s still room to grind higher, as we continue to price in the loss of Russian crude oil,” he said.
The U.S. and its allies did not sanction Russian energy, but the sanctions did inhibit buyers, banks and shippers who fear running afoul of sanctions on the Russian financial system.
“It’s pretty clear nobody wanted to be short going into the weekend,” said Kilduff. “There’s still room to grind higher as we continue to price in the loss of Russian crude oil.”
Oil traders are also watching to see if Iran is able to strike a deal that would allow it sell its oil on the market, in exchange for an end to its nuclear programs. It could then bring 1 million barrels back on to the market, but analysts say there will still be a shortfall.
This past week saw the following moves in the S&P:
(CLICK HERE FOR THE FULL S&P TREE MAP FOR THE PAST WEEK!)
S&P Sectors for this past week:
(CLICK HERE FOR THE S&P SECTORS FOR THE PAST WEEK!)
Major Indices for this past week:
(CLICK HERE FOR THE MAJOR INDICES FOR THE PAST WEEK!)
Major Futures Markets as of Friday's close:
(CLICK HERE FOR THE MAJOR FUTURES INDICES AS OF FRIDAY!)
Economic Calendar for the Week Ahead:
(CLICK HERE FOR THE FULL ECONOMIC CALENDAR FOR THE WEEK AHEAD!)
Percentage Changes for the Major Indices, WTD, MTD, QTD, YTD as of Friday's close:
(CLICK HERE FOR THE CHART!)
S&P Sectors for the Past Week:
(CLICK HERE FOR THE CHART!)
Major Indices Pullback/Correction Levels as of Friday's close:
(CLICK HERE FOR THE CHART!)
Major Indices Rally Levels as of Friday's close:
(CLICK HERE FOR THE CHART!)
Most Anticipated Earnings Releases for this week:
(CLICK HERE FOR THE CHART!)
Here are the upcoming IPO's for this week:
(CLICK HERE FOR THE CHART!)
Friday's Stock Analyst Upgrades & Downgrades:
(CLICK HERE FOR THE CHART LINK #1!)
(CLICK HERE FOR THE CHART LINK #2!)
(CLICK HERE FOR THE CHART LINK #3!)
Will Ukraine and Russia Impact The Usually Bullish March?
Good riddance to February. It was another negative month for stocks, but the clear headline was Russia invading Ukraine and the potential impacts that would have on the global economy and stock market.
First things first, this means the first two months of 2022 have been in the red for the S&P 500 Index. “Seeing the first two months of a new year in the red isn’t a great feeling, but the good news is lately it hasn’t been a major warning sign,” explained LPL Financial Chief Market Strategist Ryan Detrick. “The first two months of 2016 and 2020 were both negative, but stocks were able to claw back and finish higher those years.”
(CLICK HERE FOR THE CHART!)
It is important to remember that this is a midterm year and early in midterm years, stocks tend to have some trouble. That has played out once again in 2022, but don’t forget later in these years tend to see a very strong rally.
(CLICK HERE FOR THE CHART!)
Another angle on this is looking at how stocks do each quarter, but broken up by the four-year presidential cycle. Again, investors need to know that this quarter and the next two are some of the weakest out of the entire four-year cycle.
(CLICK HERE FOR THE CHART!)
Although midterm years tend to see overall weakness until late, be aware that March is one of the best months of the year.
(CLICK HERE FOR THE CHART!)
Lastly, looking purely at March based on seasonality shows that this is a solid month. In a midterm year, it is the fourth best month and the past 20 years it is fifth best. Since 1950, it is more in the middle at the sixth strongest. Of course, it would have been better, but the 12.5% drop in March 2020 is skewing things.
(CLICK HERE FOR THE CHART!)
Clearly headlines will move stocks in the near-term, but we continue to expect the overall economic growth in the U.S. to remain quite strong and likely push stocks back up to our fair value target of 5,000 on the S&P 500 by year-end.
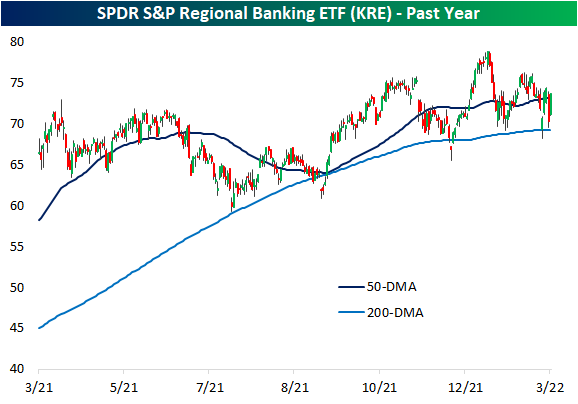
Banks (KRE) Swing Wildly
While Financials are the best performing sector so far in today's session, leading into today it was the worst-performing sector over the past week thanks in large part to a 3.7% decline on Tuesday; the sector's worst single day since June 2020. Looking more specifically at bank stocks, using the SPDR S&P Regional Banking ETF (KRE) as a proxy, yesterday saw an even more dramatic decline of 5.47% marking the largest decline since November 2020. That drop also ranks in the bottom 1% of all daily changes on record since the ETF began trading in 2006. The over 3.5% rebound today, meanwhile, ranks in the top 5% of all days on record as yesterday's decline was not quite enough to drop the industry below its 200-DMA; a support level that has now held multiple times in the past year.
(CLICK HERE FOR THE CHART!)
(CLICK HERE FOR THE CHART!)
As previously mentioned, it is rare for KRE to fall over 5% in a single day. Excluding yesterday, there were 68 other times this happened but only a dozen of those occurred with at least 3 months between the prior instance. In the table below, we show the performance of KRE after each of those periods.
While it is far from the case today, typically, the next day has often seen KRE fall further after a 5% drop. Instead, today it is seeing the second-best next-day performance of these instances. As for where things go from here though, returns have been weaker than the norm one week and one month following these past occurrences. KRE has then tended to outperform all other periods three, six, and twelve months out.
(CLICK HERE FOR THE CHART!)
S&P 500 Posts Full-Year Gain 47.1% of Time When January & February Are Both Down
The combination of a down January and a down February has come about 18 times, including this year, going back to 1950. Rest of the year and full-year performance has taken a rather sizable hit following the previous 17 occurrences. March through December S&P 500 average performance drops to 3.78% compared to 8.20% in all years. Full-year performance is even worse with S&P 500 average turning to a loss of -3.67% compared to an average gain of 9.48% in all years. All hope for 2022 is not lost as eight of the 17 past down January and down February years did go on to log gains over the last 10 months and full year while seven enjoyed double-digit gains from March to December.
(CLICK HERE FOR THE CHART!)
Are Corporate Credit Markets Starting to Crack?
Within the fixed income markets, the corporate credit markets can, at times, act like a canary in the economic coalmine. The return distribution for credit investors is asymmetrical, which means the potential for losses can be magnitudes larger than the potential for gains. So, credit markets tend to react quickly when economic conditions or corporate credit conditions start to deteriorate. And while fixed income markets broadly are down on the year, corporate credit markets (both investment grade and non-investment grade) are among the worst performing markets in the U.S. this year. Should investors take this as a sign that corporate credit markets are showing signs of stress? We don’t think so.
“U.S. corporate credit markets have underperformed this year but not because of increased credit risks, in our view,” noted LPL Financial Fixed Income Strategist Lawrence Gillum. “That we’re seeing broad based negative returns across most fixed income asset classes is largely due to higher Treasury yields and not deteriorating credit fundamentals.”
A Credit Default Swap Index (CDX) is a benchmark index that tracks a basket of U.S. corporate credit issuers and tends to act like an insurance policy in the case of an issuer’s default. In essence, credit default swaps strip out most of the interest rate risk of an issuer/security and measures just the credit risk. As seen in the LPL Chart of the Day, credit default swap indexes have increased this year but remain well within normal ranges.
(CLICK HERE FOR THE CHART!)
As inflationary pressures have broadened this year, Treasury yields, across the curve, have increased due to expectations of Federal Reserve (Fed) interest rate hikes. That’s been the main driver of broad-based bond losses and we don’t think it should raise concerns about credit fundamentals. Moreover, we’re seeing the costs to insure the higher rated cohorts (the investment grade issuers) increase at a faster pace than the more default prone, non-investment grade cohort, confirming for us that the increase in cost is due to higher Treasury yields and not a deterioration in corporate credit conditions.
From a fundamental perspective, corporate balance sheets are still in good shape. Leverage ratios have increased recently, but net debt ratios (debt minus cash on the balance sheets) remain within historical norms. Also, due to the record amount of issuance over the last few years, companies were able to refinance debt at very low interest rates and push back when that debt was set to mature. As such, interest expenses have come down and now many corporations don’t need to access the capital markets anytime soon. We do continue to watch how these companies manage capital allocation decisions. Increases in M&A activity, share buybacks, and outsized dividends are all risks to bondholders and things that may lead to deteriorating credit fundamentals.
High Levels of Volatility
It's been a volatile start to 2022 so far. With an average intraday trading range of two percentage points, the S&P 500's average intraday range in the first 41 trading days of the year has been the widest since 2009, and the only other year besides 2009 where the average range was wider was 2008.
(CLICK HERE FOR THE CHART!)
High levels of intraday volatility tend to coincide with periods of elevated uncertainty among investors and typically occur during periods when the market is lower. When the average daily range of the S&P 500 has been more than 1.5 percentage points during the first 41 trading days of the year, the average YTD performance of the S&P 500 was a decline of 5.7% (median: -4.3%). This significantly trails the average gain of 1.3% (median: 2.0%) of all years since 1983. So far this year, the S&P 500 has had the second-worst start since 1983 trailing just 2009, when the S&P 500 tanked 25.3% in the first 41 trading days.
Regarding forward returns after these volatile starts, returns vary. Although performance over the following one and three months tended to be better than average and more consistent to the upside, over the following six months and for the rest of the year, performance was more mixed.
(CLICK HERE FOR THE CHART!)
Job Gains Surprise to the Upside But Fed Will Still Likely Hike by 25 Basis Points Next Meeting
The U.S. economy added 678,000 jobs in February and this strong report exceeded consensus forecast of 423,000. The unemployment rate fell to 3.8 percent from 4 percent in January, edging closer to pre pandemic levels. In February 2020, the unemployment rate was 3.5 percent.
The survey period for this report closed before Russia invaded Ukraine so no geopolitical impacts are in these data.
February jobs gains were broad based but mainly in the services sector as pandemic effects wane. Restaurants alone added 124,000 and the return to schooling pushed education jobs up by 112,000. Professional and business services added 95,000 jobs.
The participation rate is 62.3 percent, still 1.1 percentage points below February 2020. Participation rates are still lower than before the pandemic as individuals with young children may struggle to find childcare. The composition of the labor force is also changing as some baby boomers are taking early retirements.
In February, 13 percent worked remotely because of the pandemic, down from 15.4 percent last month. This percentage will likely continue to decline as more offices across the country loosen restrictions.
Another encouraging sign is the decline in people unable to work because of COVID-19-related business declines, either from closed or lost business. In February, 4.2 million reported inability to work because of business disruptions, down from 6 million last month.
“The February jobs numbers are encouraging but overall, this does not change expectations for how the FOMC will set interest rates at the next meeting. The big conundrum for policy makers right now is how to relieve inflation fatigue yet still protect the economy from geopolitical stress,” said LPL Financial Chief Economist Jeffrey Roach.
Wage growth is slowing. February average hourly earnings were unchanged from January and up 5.1 percent from a year ago. Looking ahead, wages may begin to moderate as the labor market loosens. Participation rates should continue to increase to pre-pandemic levels by the end of this year.
As shown in the LPL Chart of the Day, February posted one of the strongest reports in the last 12 months. The reopening process is supporting the services sector and hiring in services industries like leisure and hospitality strongly contributed to the headline gain in employment. This latest release from the Bureau of Labor Statistics will not likely change the minds of the FOMC in the upcoming meeting. Chairman Powell already revealed his preference for a 25 basis point hike in rates and this is the most likely action.
(CLICK HERE FOR THE CHART!)
Here are the most notable companies reporting earnings in this upcoming trading week ahead-
(CLICK HERE FOR NEXT WEEK'S MOST NOTABLE EARNINGS RELEASES!)
(CLICK HERE FOR NEXT WEEK'S HIGHEST VOLATILITY EARNINGS RELEASES!)
(CLICK HERE FOR THE NOTABLE EARNINGS BEFORE THE OPEN ON MONDAY!)
Below are some of the notable companies coming out with earnings releases this upcoming trading week ahead which includes the date/time of release & consensus estimates courtesy of Earnings Whispers:
Monday 3.7.22 Before Market Open:
(CLICK HERE FOR MONDAY'S PRE-MARKET EARNINGS TIME & ESTIMATES!)
Monday 3.7.22 After Market Close:
(CLICK HERE FOR MONDAY'S AFTER-MARKET EARNINGS TIME & ESTIMATES LINK# 1!)
Tuesday 3.8.22 Before Market Open:
(CLICK HERE FOR TUESDAY'S PRE-MARKET EARNINGS TIME & ESTIMATES!)
Tuesday 3.8.22 After Market Close:
(CLICK HERE FOR TUESDAY'S AFTER-MARKET EARNINGS TIME & ESTIMATES!)
Wednesday 3.9.22 Before Market Open:
(CLICK HERE FOR WEDNESDAY'S PRE-MARKET EARNINGS TIME & ESTIMATES!)
Wednesday 3.9.22 After Market Close:
(CLICK HERE FOR WEDNESDAY'S AFTER-MARKET EARNINGS TIME & ESTIMATES!)
Thursday 3.10.22 Before Market Open:
(CLICK HERE FOR THURSDAY'S PRE-MARKET EARNINGS TIME & ESTIMATES!)
Thursday 3.10.22 After Market Close:
(CLICK HERE FOR THURSDAY'S AFTER-MARKET EARNINGS TIME & ESTIMATES LINK #1!)
(CLICK HERE FOR THURSDAY'S AFTER-MARKET EARNINGS TIME & ESTIMATES LINK #2!)
Friday 3.11.22 Before Market Open:
(CLICK HERE FOR FRIDAY'S PRE-MARKET EARNINGS TIME & ESTIMATES LINK!)
Friday 3.11.22 After Market Close:
([CLICK HERE FOR FRIDAY'S AFTER-MARKET EARNINGS TIME & ESTIMATES!]())
(NONE.)
(T.B.A. THIS WEEKEND.)
(T.B.A. THIS WEEKEND.) (T.B.A. THIS WEEKEND.).
(CLICK HERE FOR THE CHART!)
DISCUSS!
What are you all watching for in this upcoming trading week?
I hope you all have a wonderful weekend and a great trading week ahead r/stocks. 🙂
Leave a Reply