Good Friday evening to all of you here on r/stocks! I hope everyone on this sub made out pretty nicely in the market this past week, and are ready for the new trading week ahead. 🙂
Here is everything you need to know to get you ready for the trading week beginning August 15th, 2022.
Dow closes up 400 points, S&P 500 rises for fourth straight week as investors warm to cooler inflation – (Source)
Stocks rose sharply on Friday, clinching the fourth straight positive week for the S&P 500 as investors celebrated signs that inflation may be peaking.
The Dow Jones Industrial Average added 424.38 points, or 1.27%, to close at 33,761.05. The S&P 500 gained 1.73% to finish at 4,280.15, and the Nasdaq Composite surged 2.09% to 13,047.19.
The S&P 500 rose 3.26% on the week, notching its longest weekly winning streak since November 2021. The Dow was up 2.92% for the week, while the Nasdaq Composite moved higher by 3.08%. For the Nasdaq, it was also the fourth positive week in a row.
The averages have been boosted by positive news on the inflation front. The consumer price index was flat from June to July, thanks in large part to falling gas prices, which lowered headline inflation. The producer price index showed a surprise decline. On Friday, import prices also fell more than expected.
This week’s moves have extended a market rally off its mid-June lows. The S&P 500 has gained 16.7% since the lows, and has cut its losses from the peak in half. The Dow had gained nearly 13% and the Nasdaq Composite has rebounded 22.6%.
The positive news has bolstered investor confidence, leading some to believe that the recent gains are more than a typical bear market rally.
“We are not arguing that the market will make new highs this year (we are more in the trading range camp), but we would not be surprised to see a run toward the highs as inflation eases and the Fed slows the pace of rate hikes,” Michael Darda, chief economist and market strategist at MKM Partners, said in a note.
This past week saw the following moves in the S&P:
(CLICK HERE FOR THE FULL S&P TREE MAP FOR THE PAST WEEK!)
S&P Sectors for this past week:
(CLICK HERE FOR THE S&P SECTORS FOR THE PAST WEEK!)
Major Indices for this past week:
(CLICK HERE FOR THE MAJOR INDICES FOR THE PAST WEEK!)
Major Futures Markets as of Friday's close:
(CLICK HERE FOR THE MAJOR FUTURES INDICES AS OF FRIDAY!)
Economic Calendar for the Week Ahead:
(CLICK HERE FOR THE FULL ECONOMIC CALENDAR FOR THE WEEK AHEAD!)
Percentage Changes for the Major Indices, WTD, MTD, QTD, YTD as of Friday's close:
(CLICK HERE FOR THE CHART!)
S&P Sectors for the Past Week:
(CLICK HERE FOR THE CHART!)
Major Indices Pullback/Correction Levels as of Friday's close:
(CLICK HERE FOR THE CHART!)
Major Indices Rally Levels as of Friday's close:
(CLICK HERE FOR THE CHART!)
Most Anticipated Earnings Releases for this week:
(CLICK HERE FOR THE CHART!)
Here are the upcoming IPO's for this week:
(CLICK HERE FOR THE CHART!)
Friday's Stock Analyst Upgrades & Downgrades:
(CLICK HERE FOR THE CHART LINK #1!)
(CLICK HERE FOR THE CHART LINK #2!)
(CLICK HERE FOR THE CHART LINK #3!)
VIX and Volatility Have Historically Increased August through October
(CLICK HERE FOR THE CHART!)
Historically speaking, the CBOE Volatility Index (VIX) tends to reach its seasonal low in late-July or early August and slowly begin climbing towards its seasonal high, usually in the month of October. This may be due to the fact that the two worst performing months of the year, August and September (by average performance) precede it. VIX’s seasonal pattern can be seen in the following chart.
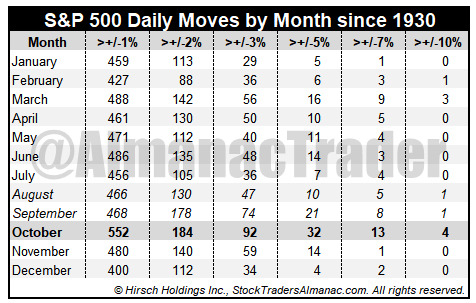
October’s volatility peak is also visible when closing daily percent changes are analyzed. October has hosted the most daily moves in excess of 1%, 2%, 3%, 5%, 7% and even 10% since 1930. Do not fret over the ten times S&P 500 has moved more than 10% in a single day. Six of the ten occurrences were way back in the 1930’s. Only four have occurred more recently and out of those, two were actually positive days (10/13/2008 +11.58% and 10/28/2008 +10.79%). Only three of the ten days with moves in excess of 10% were negative days: 3/18/1935 –10.06%, 10/19/1987 –20.47% and 3/16/2020 –11.98%.
(CLICK HERE FOR THE CHART!)
Putting all but the +/-1% moves table data into a bar chart adds a quick confirmation of October’s heightened volatility versus all other months. Volatility’s trend can also be observed as the frequency of sizable daily moves tends to decline from March through July then an increase in August lasting until October.
(CLICK HERE FOR THE CHART!)
High Short Interest Revival
As we detailed in last night's Closer, whatever name that it might be given—meme stocks, yolo trades, or “stonks”—there has been a trend recently in which there has been strong performance of highly volatile names loved by the most risk tolerant retail investor. That is roughly a year and a half to the day of the meme stock mania where highly shorted names saw massive short squeezes driven by the retail community.
Since the mid-June lows, highly shorted names have again been outperforming. Below we show the chart of an index covering the 100 most highly shorted stocks going back to early 2020. The vast majority of 2020 gains have been erased, however, this index has also risen 46% since its June 16th low (the same date as the broader market's low). On a relative basis, the most heavily shorted stocks have been outperforming the Russell 3,000 in that time resulting in the relative strength line to break out of the downtrend that has been in place since the peak of the meme stock mania in late January of last year. That being said, the index itself has much further to go in order to break out of its downtrend off of that high in price.
(CLICK HERE FOR THE CHART!)
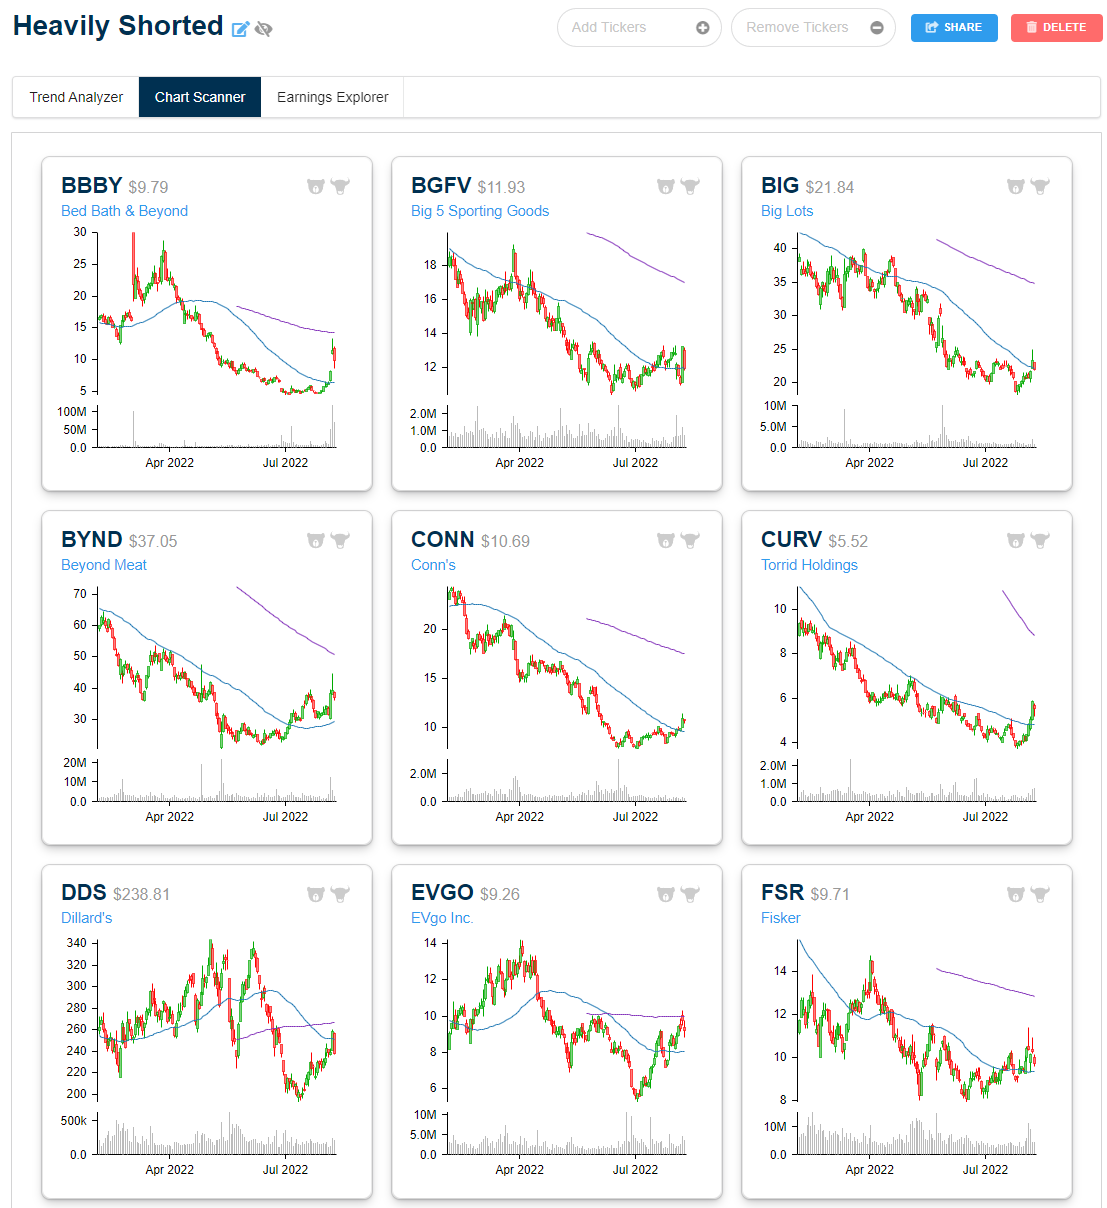
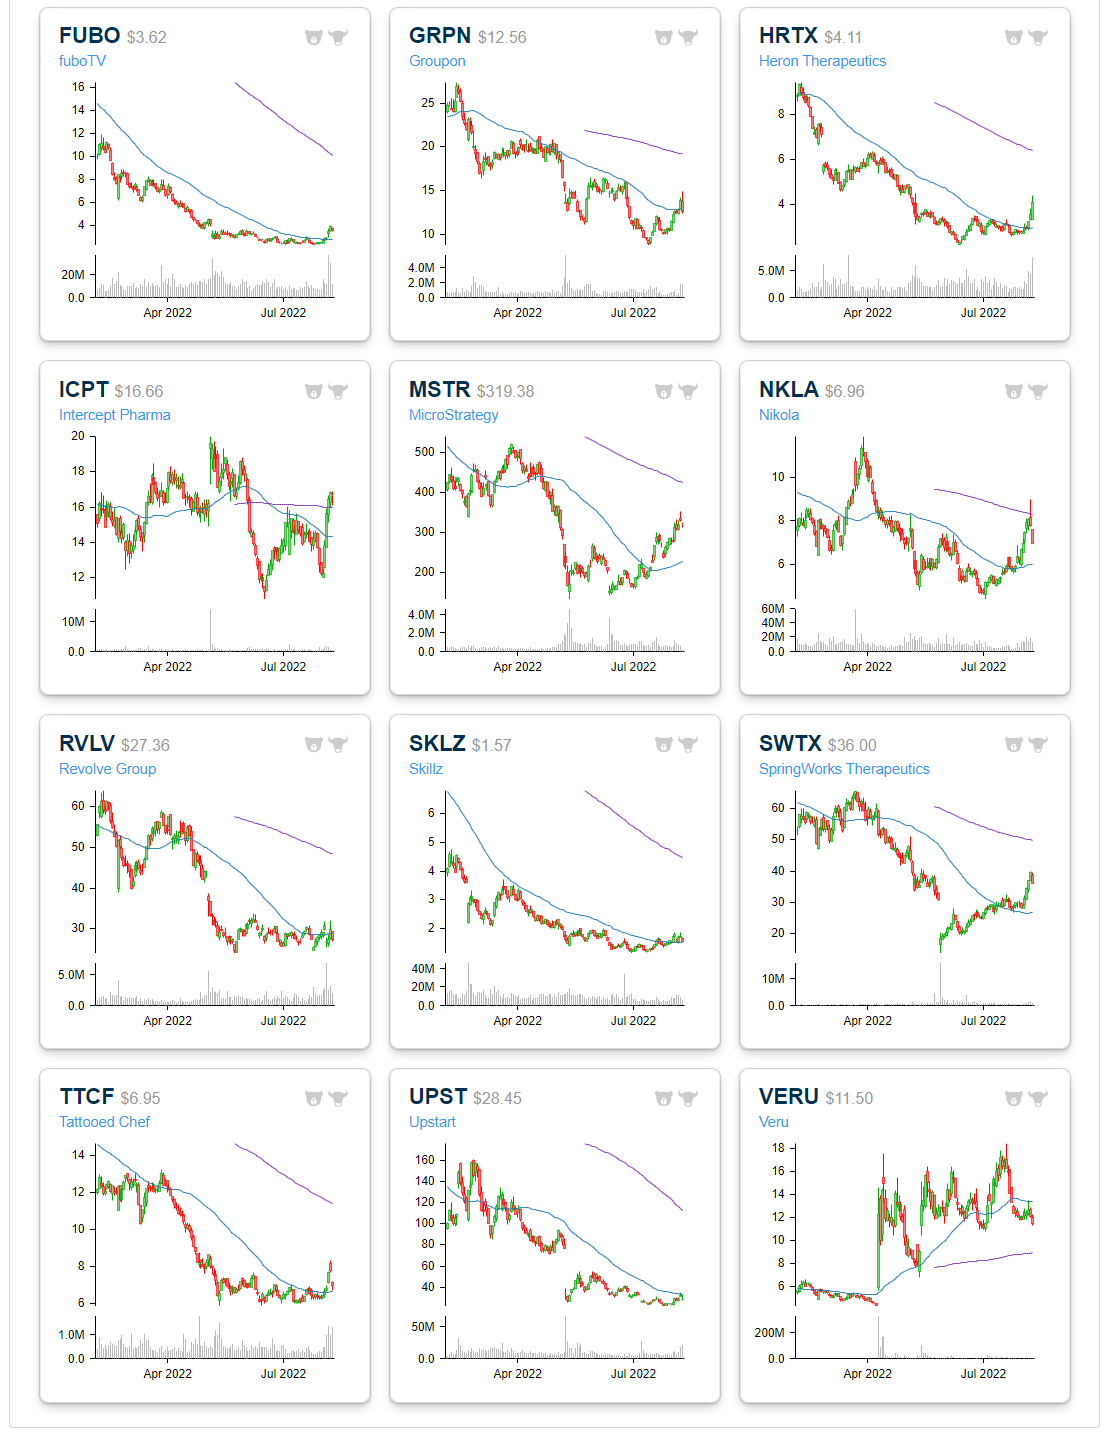
Below we show the stocks within the Russell 3,000 that currently have the highest levels of short interest as of the end of July. The only stock with more than 50% of its float sold short is Torrid Holdings (CURV). The next highest is a company that frequently finds itself high up on the list of highly shorted stocks: Dillard's (DDS). While those readings are elevated, they are well below what had been the most heavily shorted stock a month and a half ago. As of the mid-June update, Redbox (RDBX) had an extremely elevated reading on short interest that was closing in on 100%. Today that reading has collapsed back down to a still elevated but less extreme 41.5%. We would also note, however, that RDBX is a messy story at the moment in the midst of an acquisition (confirmed to go through in the past 24 hours) with the potential to save the company from bankruptcy.
Other notables on the list of most heavily shorted stocks include grill-maker Weber (WEBR), Bed Bath & Beyond (BBBY), Upstart (UPST), Big 5 Sporting Goods (BGFV), Beyond Meat (BYND), Groupon (GRPN), and Nikola (NKLA). Click here to learn more about Bespoke's premium stock market research service.
(CLICK HERE FOR THE CHART!)
Below is a look at price charts for most of the heavily shorted stocks listed in the table above. While many of these names are up huge since mid-June, the gains hardly register on six-month charts because they got hit so hard in the first half of the year.
(CLICK HERE FOR THE CHART!)
(CLICK HERE FOR THE CHART!)
The Nature of Risk
(CLICK HERE FOR THE CHART!)
Here is a little sneak peek into the 2023 Stock Trader’s Almanac from Justin Mamis’ The Nature of Risk that is remarkably apropos now. 2022 continues to track this Sentiment Cycle rather closely.
Just before we presented at the CMT Association’s 2022 Annual Symposium veteran technical analyst Helene Meisler shared Mamis’ Sentiment Cycle along with her analysis of where in the cycle the market was at the time at the end of April 2022—in that brief pause between disbelief and panic (green circle).
(CLICK HERE FOR THE CHART!)
Comparing the current chart of the S&P 500 below we’ve highlighted in yellow that area of disbelief Ms. Meisler pointed out in April. The June low correlates quite well with Panic and we are now hitting the first level of Anxiety.
This dovetails with our seasonal/cycle outlook for a lower low or retest of the lows over the next three months as we are in the worst two months of the year and are smack dab in the “Weak Spot” of the 4-Year Cycle from Q2 to Q3 of the midterm election year, which sets up the Sweet Spot and the Quadrennial Rally.
We will know more tomorrow after the big CPI report comes out. If CPI cools considerably that would suggest we have passed the Panic point and are on the other side of Discouragement and climbing the Wall of Worry toward Anxiety before a higher low at Aversion.
Inflation Still Top Of Mind for Small Business
While fewer respondents to this month's NFIB small business survey reported that they observed higher prices, inflation continues to be a front and center concern. The percentage of respondents reporting inflation as their biggest problem has risen further to another record high of 37%. That completely erased June's drop down to 34%.
(CLICK HERE FOR THE CHART!)
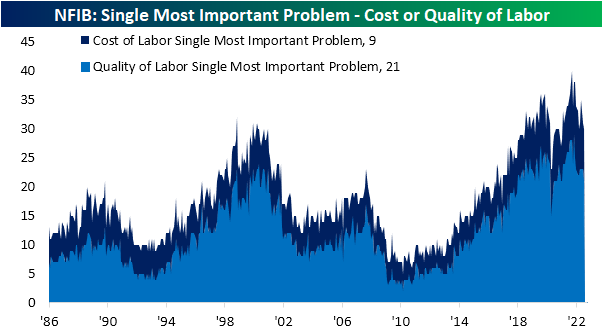
While broad inflation is currently the most pressing problem, other inflation-related measures also rose in July. The percentage of firms reporting cost of labor as their single most important problem rose to 9%, although that is still below the record high reading of 13% at the end of last year.
While we often combine that reading with the percentage of responses reporting quality of labor as the biggest issue as a gauge of labor market health, the latter problem dropped 2 percentage points to net out the rise in cost of labor. On a combined basis, these two concerns are now tied with March at 30% for the lowest level since January 2021 (28%).
(CLICK HERE FOR THE CHART!)
One other combined reading that we often check in on is the percentage of respondents reporting government requirements or taxes as their biggest issues. Over the past few decades, Republican administrations have usually coincided with lower readings whereas Democrat administrations would see a higher reading. With inflation concerns surging this year, a historically low share of businesses are concerned about government action. The combined reading fell to another record low of 16% in July with the entirety of that drop on account of a 3 percentage point decline in government requirements and red tape.
(CLICK HERE FOR THE CHART!)
Risk of Default Declining
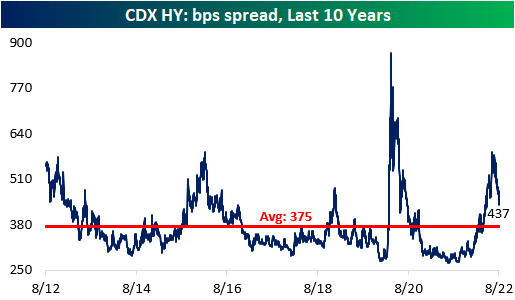
We like to use credit default swaps (a product that pays out investors if a reference company defaults) to track risk premiums in the corporate bond market. When risk premiums rise, credit default swaps get more expensive, and the spread implied between risk free rates and CDS rises.
As recession fears intensified throughout the first half of 2022, both the investment grade and high yield credit default swap indices skyrocketed, gaining 106.7% and 110.5% between the start of the year and the highs, respectively. However, earnings were not as bad as feared, economic data is starting to come in better than expected, gas prices have fallen, and CPI seems to have peaked in June. All of this has caused substantial declines in CDS index spreads, with the risk premium associated with each falling by about a quarter since their summer peak.
(CLICK HERE FOR THE CHART!)
(CLICK HERE FOR THE CHART!)
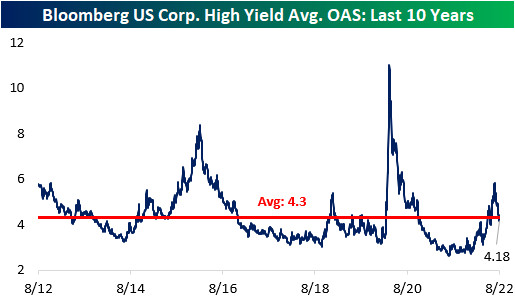
Although CDX High Yield's spread is well off of its highs, it is still above the average over the last ten years, implying a still elevated risk related to recession and potential defaults. We can also tie CDS indices to the performance of actual corporate bonds. The option-adjusted spread (a proxy for the credit risk over risk-free rates for a given investment) for high yield bonds in the “cash” market has a 0.88 correlation to CDS over the past decade. Notably, the CDX HY spread remains above its long-term average, while that High Yield Average OAS is below its average, implying investors may be getting under-compensated for the risk they are taking in the high yield debt market.
(CLICK HERE FOR THE CHART!)
(CLICK HERE FOR THE CHART!)
Normalizing Sentiment
Sentiment has continued to head back towards more normal levels as equities press higher. The latest reading from the AAII on the percentage of investors that are bullish on the S&P 500 over the next six months reached the highest level since March. At 32.2%, bullish sentiment is now only 5.5% below the historical average.
(CLICK HERE FOR THE CHART!)
The reading on bearish sentiment meanwhile has dropped to 36.7% which is also the lowest reading since the end of March; the last time this reading was below 30%.
(CLICK HERE FOR THE CHART!)
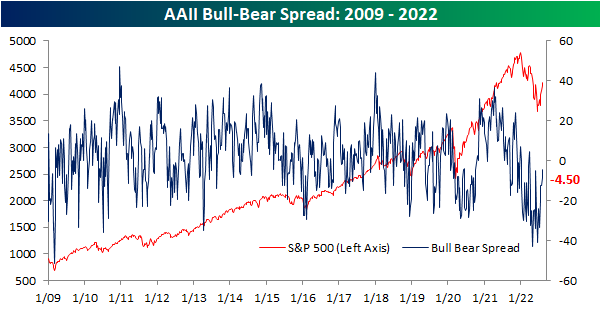
Although both bullish and bearish sentiment are closing in on one another, bears continue to outnumber bulls. The bull-bear spread rose to -4.5 this week extending the streak of negative readings to 19 weeks long. At the moment, that is the third longest streak on record and would need to continue for at least three weeks more to tie the second-longest streak on record of 22 weeks ending in December 1990.
(CLICK HERE FOR THE CHART!)
While the bull-bear spread remains negative for the AAII survey, other sentiment surveys have been showing more bullish sentiment. The Investors Intelligence survey has had a positive bull-bear spread for three weeks in a row now, and the NAAIM exposure index has shown investment managers have been quick to add exposure to equities in recent weeks. Standardizing these three survey results (measuring each one in how many standard deviations from the long-term average they are), the NAAIM and Investors Intelligence surveys are now back into positive territory. In other words, these two surveys are actually showing sentiment as having moved slightly above what has been the historical norm. Meanwhile, the AAII reading is far more negative even if it is trending higher.
(CLICK HERE FOR THE CHART!)
Additionally, those are the first positive readings in some time. For the NAAIM index, the z-score has not seen a positive reading in 15 weeks. That is the longest stretch without a positive reading since the first quarter of 2016 and prior to that, there have only been a handful of other streaks that have gone on as long. For the Investors Intelligence survey, it was an even rarer streak ending at 29 weeks long. That was the longest since one that went on for roughly a year and ended in May 2009. Prior to that, you would have to go all the way back to 1995 to find a longer streak.
Then there are the AAII results. Still going at 32 weeks long, the z-score has only been negative for as many consecutive weeks once in the survey's history, and that was during 2020. All of this is to say that the AAII survey has been leaning more pessimistically than other surveys even as overall sentiment has largely made its way back to historically normal levels.
(CLICK HERE FOR THE CHART!)
Here are the most notable companies (tickers) reporting earnings in this upcoming trading week ahead-
- (T.B.A. THIS WEEKEND.)
(CLICK HERE FOR NEXT WEEK'S MOST NOTABLE EARNINGS RELEASES!)
(CLICK HERE FOR NEXT WEEK'S HIGHEST VOLATILITY EARNINGS RELEASES!)
(CLICK HERE FOR MONDAY'S PRE-MARKET NOTABLE EARNINGS RELEASES!)
Below are some of the notable companies coming out with earnings releases this upcoming trading week ahead which includes the date/time of release & consensus estimates courtesy of Earnings Whispers:
Monday 8.15.22 Before Market Open:
(CLICK HERE FOR MONDAY'S PRE-MARKET EARNINGS TIME & ESTIMATES!)
Monday 8.15.22 After Market Close:
(CLICK HERE FOR MONDAY'S AFTER-MARKET EARNINGS TIME & ESTIMATES LINK #1!)
(CLICK HERE FOR MONDAY'S AFTER-MARKET EARNINGS TIME & ESTIMATES LINK #2!)
Tuesday 8.16.22 Before Market Open:
(CLICK HERE FOR TUESDAY'S PRE-MARKET EARNINGS TIME & ESTIMATES!)
Tuesday 8.16.22 After Market Close:
(CLICK HERE FOR TUESDAY'S AFTER-MARKET EARNINGS TIME & ESTIMATES!)
Wednesday 8.17.22 Before Market Open:
(CLICK HERE FOR WEDNESDAY'S PRE-MARKET EARNINGS TIME & ESTIMATES!)
Wednesday 8.17.22 After Market Close:
(CLICK HERE FOR WEDNESDAY'S AFTER-MARKET EARNINGS TIME & ESTIMATES!)
Thursday 8.18.22 Before Market Open:
(CLICK HERE FOR THURSDAY'S PRE-MARKET EARNINGS TIME & ESTIMATES!)
Thursday 8.18.22 After Market Close:
(CLICK HERE FOR THURSDAY'S AFTER-MARKET EARNINGS TIME & ESTIMATES!)
Friday 8.19.22 Before Market Open:
(CLICK HERE FOR FRIDAY'S PRE-MARKET EARNINGS TIME & ESTIMATES!)
Friday 8.19.22 After Market Close:
([CLICK HERE FOR FRIDAY'S AFTER-MARKET EARNINGS TIME & ESTIMATES!]())
(NONE.)
(T.B.A. THIS WEEKEND.)
(T.B.A. THIS WEEKEND.) (T.B.A. THIS WEEKEND.).
(CLICK HERE FOR THE CHART!)
DISCUSS!
What are you all watching for in this upcoming trading week?
I hope you all have a wonderful weekend and a great trading week ahead r/stocks. 🙂
Leave a Reply