Good Friday evening to all of you here on r/stocks! I hope everyone on this sub made out pretty nicely in the market this past week, and are ready for the new trading week ahead. 🙂
Here is everything you need to know to get you ready for the trading week beginning July 11th, 2022.
Another hot inflation report and the start of earnings season make for a challenging week ahead – (Source)
Consumer inflation data and the start of the second quarter earnings season could be two catalysts that make for a bumpy ride in markets in the week ahead.
PepsiCo’s earnings are the first major report of the week Tuesday, and Delta Air Lines reports Wednesday. JPMorgan Chase and Morgan Stanley kick off bank earnings season Thursday, and Wells Fargo, Citigroup and PNC Financial, among others, follow on Friday.
A cluster of inflation reports could affect markets, since they help set the tone for how aggressive the Federal Reserve will have to be in its battle to calm inflation.
The June consumer price index looms large on Wednesday, and economists expect it could be hotter than May’s 8.6% year-over-year pace. It is also the report that could move markets most.
“The headline is expected to be higher. That’s mostly because of energy,” said Peter Boockvar, chief investment officer at Bleakley Advisory Group. He added that core inflation, excluding food and energy, could be lower. West Texas Intermediate crude futures were as high as $122 per barrel in June, but have since fallen back in July and was just under $105 per barrel Friday.
“The question is to what extent the moderation in goods prices is going to be offset by continued increasing services prices, predominantly driven by rent,” Boockvar said. “The government stats still have a lot of catch up room to the upside on rent.”
There is also the June producer price index Thursday, and investors are closely watching Friday’s University of Michigan consumer sentiment report for July. That report contains consumer expectations about future inflation, an important metric watched by the Federal Reserve. June retail sales, another measure of the consumer, is also released Friday.
“PPI is the seed for CPI…and it could have another 10% handle,” said Boockvar.
The new inflation data comes on the heels of Friday’s strong employment report. In June, the economy added 372,000 jobs, about 120,000 more than expected. Strategists say the report reinforced expectations that the Federal Reserve will raise rates by another 75 basis points later this month. A basis point is one one-hundredth of a percentage point.
“It was enough to continue on the path they’ve chosen. It’s not until you start to see rising unemployment on a monthly basis that I believe the Fed will start to buckle its knees,” said Boockvar.
A key question for markets is when will inflation peak, as it has already continued to flare higher much longer than the Fed had initially anticipated.
“I do think a risk to the markets is this fact that inflation may not have peaked,” said Michael Arone, chief investment strategist at State Street Global Advisors. “I do still believe the markets are at least hopeful, if not expecting, that inflation will decelerate.”
As investors watch the pace of inflation, the second quarter earnings season begins. Corporate profits could be the source of some market turbulence, if analysts are force to chop estimates for the balance of the year, as many expect.
“The street has not really changed the estimates. Revenue growth has ticked down. Margins are compressing. Analysts are leaving their estimates unchanged,” said Boockvar. “If there’s going to be a readjustment, this is the time.”
Second quarter earnings for the S&P 500 are expected to grow by 5.7%, according to I/B/E/S data from Refinitiv. The third- and fourth quarter estimates have been moving down slightly, but are still 10.9% and 10.5%, respectively.
“I think the market is bracing for a challenging earnings quarter, so how much it will result in volatility is unclear,” said Arone. He said companies will continue to beat but maybe by not as much. “I think they will lower their guidance. Why not? It just makes it easier to beat down the road. I do think earnings season will be a disappointment. It will be interesting to see how the market reacts.”
Stocks in the past week were higher, with the S&P 500 gaining 1.9% to 3,899. The Nasdaq rose 4.5% for the week.
The worst performing major sectors for the week were utilities and energy. The S&P consumer discretionary sector, which benefits from lower oil prices, bounced more than 4.5% on the week.
The 10-year Treasury note was yielding about 3.07% Friday, but the 2-year note yield surpassed the 10-year this past week for the third time since late March. The result is a so-called inverted yield curve, which does sometimes signal recession. The 2-year yield was at 3.11% Friday afternoon.
This past week saw the following moves in the S&P:
(CLICK HERE FOR THE FULL S&P TREE MAP FOR THE PAST WEEK!)
S&P Sectors for this past week:
(CLICK HERE FOR THE S&P SECTORS FOR THE PAST WEEK!)
Major Indices for this past week:
(CLICK HERE FOR THE MAJOR INDICES FOR THE PAST WEEK!)
Major Futures Markets as of Friday's close:
(CLICK HERE FOR THE MAJOR FUTURES INDICES AS OF FRIDAY!)
Economic Calendar for the Week Ahead:
(CLICK HERE FOR THE FULL ECONOMIC CALENDAR FOR THE WEEK AHEAD!)
Percentage Changes for the Major Indices, WTD, MTD, QTD, YTD as of Friday's close:
(CLICK HERE FOR THE CHART!)
S&P Sectors for the Past Week:
(CLICK HERE FOR THE CHART!)
Major Indices Pullback/Correction Levels as of Friday's close:
(CLICK HERE FOR THE CHART!)
Major Indices Rally Levels as of Friday's close:
(CLICK HERE FOR THE CHART!)
Most Anticipated Earnings Releases for this week:
([CLICK HERE FOR THE CHART!]())
(T.B.A. THIS WEEKEND.)
Here are the upcoming IPO's for this week:
(CLICK HERE FOR THE CHART!)
Friday's Stock Analyst Upgrades & Downgrades:
(CLICK HERE FOR THE CHART LINK #1!)
(CLICK HERE FOR THE CHART LINK #2!)
Get Ready for the Quadrennial Rally
Unfortunately, the stock market is delivering on its bearish historical 4-Year Cycle and seasonal tendencies here at the midway point of 2022. It is also playing out the less than sanguine outlook we wrote last year around this time in the 2022 Stock Trader’s Almanac (pages 10-11) and in our annual forecast from last December 16. So where do we go from here?
Much to our chagrin the short answer is that we have likely not seen the low either in price or time. Current trends are now leaning towards the “Worst Case” scenario we presented in our 2022 forecast which was for a “Mild bear market for S&P 500 with 2022 ending down 10-20%.” With S&P 500 down 20.6% year-to-date at the end of June the bear is fully in place.
As we have been guiding over the past several months, we still expect this bear to put in a typical midterm election year bottom sometime in the August-October timeframe just ahead of the midterm elections. Stocks are clearly exhibiting the historical weakness that often transpires in the Worst Six Months of the year May-October and they are also tracking the “Weak Spot” of the 4-year cycle. But this should set us up for the “Sweet Spot” of the cycle from Q4 midterm year through Q2 pre-election year.
The intersection of the annual seasonal pattern and the 4-Year Cycle produces the quadrennial “Sweet Spot.” As we continue to patiently ride out this bear the chart below of the 4-year cycle may provide some solace. We are currently finalizing the 2023 edition of the Stock Trader’s Almanac so here’s a sneak peek at this new chart from the 2023 STA that highlights the midterm low and most importantly the quadrennial rally from the midterm low to the pre-election year high in what we call the Sweet Spot of the 4-year cycle.
The second and third quarter of the midterm year has been the weakest period of the entire 4-year pattern averaging losses over the 2-quarter period of -1.2% for the Dow, -1.5% for the S&P 500 and -5.0% for the NASDAQ Composite Index. But in the Sweet Spot of the cycle the Dow gains 19.3%, S&P 500 increases 20.0% and NASDAQ jumps 29.3% over the three-quarter span from midterm year Q4 to pre-election year Q2.
It is for this reason that we call midterm election years “A Bottom Pickers Paradise.” From the midterm low to the pre-election year high DJIA gains 46.8% since 1914 and NASDAQ gains a whopping 68.2% since 1974! As the 2022 bear market runs its course, the market will likely bounce along sideways, testing the lows, hitting its low point in late Q3 or early Q4 in the August-October period in prototypical midterm bottom fashion. Then be prepared for the rally off that low into the Sweet Spot and beyond to new highs.
(CLICK HERE FOR THE CHART!)
Bulls Back Below 20%
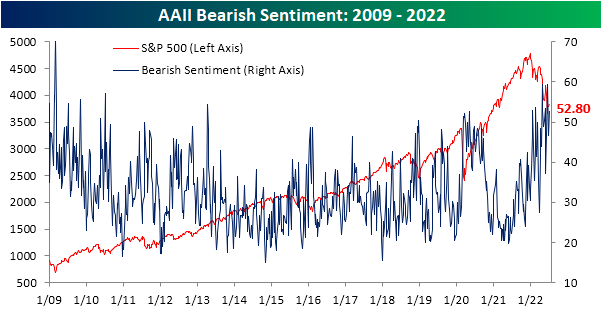
Even though the second half of June and first week of July have seen the S&P 500 climb back from its lows, sentiment appears to show that investors are not buying it. In today's update of AAII sentiment survey, there was an overall push toward more bearish tones. For starters, the percentage of respondents reporting as bullish fell back below 20%. Even though that is not any sort of new low, this week is the fifth in a row with less than a quarter of respondents reporting as bullish. As shown in the second chart below, such a streak has been unprecedented with the last example of such an extended streak of depressed sentiment being May of 1993.
(CLICK HERE FOR THE CHART!)
(CLICK HERE FOR THE CHART!)
As bulls have been no where to be found, bears are plentiful with over half of respondents reporting bearish sentiment. This week's reading came in at 52.8%, up from 46.7% last week. Mirroring bullish sentiment, that is not any sort of new pinnacle for bearish sentiment as there were even higher readings that closed in on 60% last month. Regardless, sentiment remains historically pessimistic with few other periods having seen such elevated readings for as extended of periods.
(CLICK HERE FOR THE CHART!)
With inverse moves in bulls and bears, there is now a 33.4 percentage point gap between the two readings which is in the 2nd percentile of all readings since the survey began in 1987.
(CLICK HERE FOR THE CHART!)
That leaves neutral sentiment to be the only normal reading of the survey. At 27.8%, neutral sentiment is in the middle of its pandemic range and only 3.6 percentage points below its historical average.
(CLICK HERE FOR THE CHART!)
The more bearish turn at the expense of bulls witnessed in this week's AAII survey was echoed by other readings on sentiment like the Investors Intelligence survey and NAAIM Exposure index. Combining all three of these sentiment readings into one composite, overall outlooks for the market took a further bearish turn this week with the average survey currently 1.8 standard deviations below its historical norm. That is slightly better than earlier this spring, but still, the only period since the mid-2000s with similarly pessimistic readings was in late 2008 and into 2009.
(CLICK HERE FOR THE CHART!)
Worst First Half Since 1970 Spin
As the market logged its worst first half start to the year since 1970 with DJIA down 15.3%, S&P off 20.6% and NASDAQ down 29.5%, there has been a lot of positive spin on how great second halves are when the market is down so much in the first half. Well, we did some deeper digging and went back a bit further than some of the cherry-picked stats we have seen.
Unfortunately, as you can see in this chart of DJIA Top 10 Worst First Half Starts since 1901 all but two of the years, 1939 and 1970 end down 10% or more. Five years (1932, 1939, 1940, 1962 & 1970) ended significantly higher (>5%) than their mid-year levels. Three (1907, 1920, & 2008) ended much lower and two (1910 & 1913) were flat from mid-year to yearend.
(CLICK HERE FOR THE CHART!)
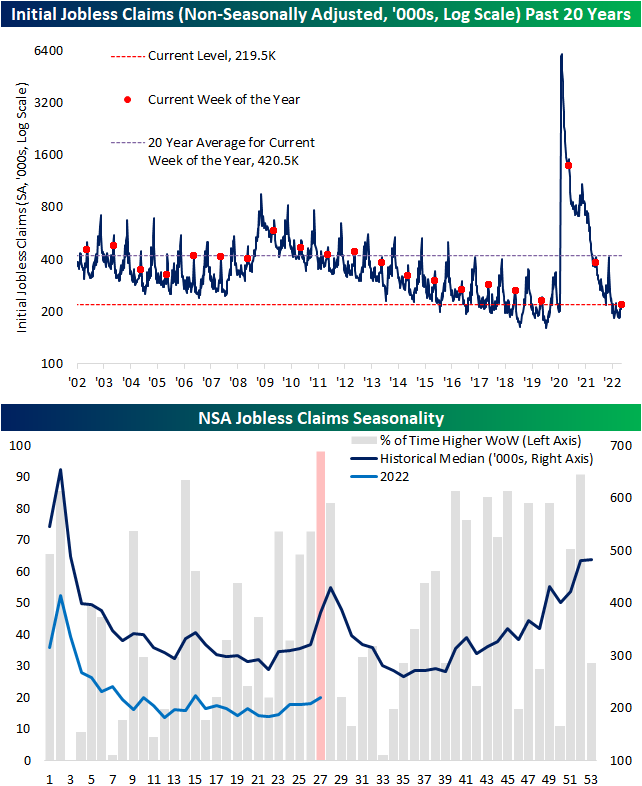
Worst Week of the Year For Claims
Initial jobless claims remain historically healthy in the low 200K range, but the most recent week's data did mark one of the highest readings of the year. Coming off of last week's unrevised 231K, claims rose 4K to the highest level since the second week of the year when they clocked in at 240K. That remains a much better reading than what was observed throughout much of the history of the data, but it is at the higher end of pre-pandemic readings (those from roughly 2017 through 2019).
(CLICK HERE FOR THE CHART!)
As for the non-seasonally adjusted number, the current week of the year is essentially guaranteed to see a week-over-week increase. The current week has historically been the worst of the year in terms of week-over-week moves only having seen unadjusted claims fall once since 1967. That one decline was in 2020 when claims were working off unprecedented record highs. Given that historically consistent drift higher in claims during this point of the year, next week has historically averaged a temporary peak in claims. While that lends to the possibility of claims continuing to rise next week, the current reading is below that of comparable weeks of pre-pandemic years. In other words, claims are following standard seasonal patterns and are doing so at historically strong levels even if they have come off the absolute strongest levels of the pandemic.
(CLICK HERE FOR THE CHART!)
Continuing claims have also begun to come off of the best levels of the pandemic. Adjusted continuing claims were expected to go unchanged at 1.328 million this week. Instead, they rose up to 1.375 million; the highest level since the week of April 22nd when claims were 12K higher.
(CLICK HERE FOR THE CHART!)
Here are the most notable companies (tickers) reporting earnings in this upcoming trading week ahead-
- (T.B.A. THIS WEEKEND.)
([CLICK HERE FOR NEXT WEEK'S MOST NOTABLE EARNINGS RELEASES!]())
(T.B.A. THIS WEEKEND.)
(CLICK HERE FOR NEXT WEEK'S HIGHEST VOLATILITY EARNINGS RELEASES!)
Below are some of the notable companies coming out with earnings releases this upcoming trading week ahead which includes the date/time of release & consensus estimates courtesy of Earnings Whispers:
Monday 7.11.22 Before Market Open:
(CLICK HERE FOR MONDAY'S PRE-MARKET EARNINGS TIME & ESTIMATES!)
Monday 7.11.22 After Market Close:
(CLICK HERE FOR MONDAY'S AFTER-MARKET EARNINGS TIME & ESTIMATES!)
Tuesday 7.12.22 Before Market Open:
(CLICK HERE FOR TUESDAY'S PRE-MARKET EARNINGS TIME & ESTIMATES!)
Tuesday 7.12.22 After Market Close:
([CLICK HERE FOR TUESDAY'S AFTER-MARKET EARNINGS TIME & ESTIMATES!]())
(NONE.)
Wednesday 7.13.22 Before Market Open:
(CLICK HERE FOR WEDNESDAY'S PRE-MARKET EARNINGS TIME & ESTIMATES LINK!)
Wednesday 7.13.22 After Market Close:
(CLICK HERE FOR WEDNESDAY'S AFTER-MARKET EARNINGS TIME & ESTIMATES!)
Thursday 7.14.22 Before Market Open:
(CLICK HERE FOR THURSDAY'S PRE-MARKET EARNINGS TIME & ESTIMATES!)
Thursday 7.14.22 After Market Close:
(CLICK HERE FOR THURSDAY'S AFTER-MARKET EARNINGS TIME & ESTIMATES!)
Friday 7.15.22 Before Market Open:
(CLICK HERE FOR FRIDAY'S PRE-MARKET EARNINGS TIME & ESTIMATES!)
Friday 7.15.22 After Market Close:
([CLICK HERE FOR FRIDAY'S AFTER-MARKET EARNINGS TIME & ESTIMATES!]())
(NONE.)
(T.B.A. THIS WEEKEND.)
(T.B.A. THIS WEEKEND.) (T.B.A. THIS WEEKEND.).
(CLICK HERE FOR THE CHART!)
DISCUSS!
What are you all watching for in this upcoming trading week?
I hope you all have a wonderful weekend and a great trading week ahead r/stocks. 🙂
Leave a Reply