Good Friday evening to all of you here on r/stocks! I hope everyone on this sub made out pretty nicely in the market this past week, and are ready for the new trading week ahead. 🙂
Here is everything you need to know to get you ready for the trading week beginning June 4th, 2022.
Recession fears flare and June jobs report looms as jittery markets head into third quarter – (Source)
Investors are greeting the third quarter with greater trepidation about a recession, and that makes next Friday’s June jobs report a potentially bigger catalyst for markets than it might otherwise have been.
The jobs report and Wednesday’s release of minutes from the Federal Reserve’s last interest rate meeting are expected to highlight the four-day, post-July 4th holiday week.
June’s nonfarm payrolls are expected to have slowed from the 390,000 added in May, but still show solid job growth and a strong labor market. According to Dow Jones, economists expect 250,000 payrolls were added in June and the unemployment rate held steady at 3.6%.
But economists expect to see a slowing in the employment data from here out, as the Fed’s tighter rates policy squeezes employers and the economy. There is a chance some of those cracks in the labor market could start to appear in the latest report. Some slowing would be seen as a positive, but there’s a balance between a slower, less hot job market and one that has gotten too cool.
“Employment should slow from May. Whether it goes to 250,000 consensus or more, there’s always volatility,” said David Page, head of macro economic research at AXA Investment Managers. “The trend is going to be lower, and I wouldn’t mind betting it would be in 150,000 to 200,000 by early Q3, and it could be certainly lower by the end of the year.”
A rate of 150,000 to 200,000 is still strong and closer to the pre-pandemic pace of job growth.
Page said there has been a slowing in other data, including consumer spending, income and the employment component of the ISM June manufacturing survey. The employment component fell for a third month to 47.3. A level under 50 signals contraction.
“That’s part of a trend we’re seeing emerge. It’s very evidently a slowdown in the economy,” Page said. “The warning signs are starting to emerge, and the more we see those warning signs start to trickle into the labor market, the more the Federal Reserve is going to have to take heed and that’s what puts such focus on next Friday’s payroll report.”
On the other hand, if the jobs number is particularly strong, markets could react negatively since it would mean the Fed would feel forced to move ahead aggressively to fight inflation with larger rate hikes.
Fed impact
“If the employment data is strong, and the Fed officials on paper sound as hawkish as they do verbally, I would think that would continue to put pressure on the market,” said Sam Stovall, chief investment strategist at CFRA. “If one of the major barometers of how well higher rates are affecting the economy does not show, it is affecting the economy. The implication or inference would be the Fed still has more to go.”
Many economists expect the Fed will raise interest rates by another 75 basis points at its next policy meeting in late July, but the path for September is less certain.
Page said he expects the Fed will debate the size of July’s hike more than the market believes, and the central bank could end up raising rates by a lower-than-expected 50 basis points. A basis point equals 0.01%. Page expects the Fed to be sensitive to the slowing economy and tightening of financial conditions.
He noted there are few instances in history where the Fed has managed “a soft landing on such a narrow landing strip.”
A major issue for markets is that the economy can easily fall into recession, and it can be hard to predict. This week market pros became more concerned about an economic downturn, after weaker data and comments from Fed Chairman Jerome Powell. Powell indicated the Fed will do what it needs with interest rate hikes to tame inflation, triggering worries the Fed will be willing to bring on a recession to slow price increases.
“You can be traveling along, then you hit a certain tipping point,” Page said. “It starts with something as amorphous as market sentiment. The market sentiment starts to evaporate…That’s when financial conditions start to tighten…That has a knock on to economic activity.”
Economists are divided on when and whether the economy will enter a recession, but increasingly markets are pricing in an economic contraction.
The Atlanta Fed’s GDP Now tracker shows the economy is already in a recession, with a forecast of gross domestic product declining 2.1% in the second quarter. If that forecast were accurate, it would make for a second negative quarter in a row, or what’s considered a recession on Wall Street. The first quarter contracted by 1.6%.
Other economists, however, are not forecasting a recession for the current period, and Page sees 1.5% growth in the second quarter.
New test for stocks?
Stocks in the past week were sharply lower, as Treasury yields also fell on recession expectations. The 10-year yield stood at 2.89% on Friday, tumbling from 3.49% just two weeks ago. Some strategists had expected to see an up week for stocks as portfolio managers bought equities to rebalance their portfolios at the end of the second quarter.
The S&P 500 rallied 1% Friday but was off 2.2% for the week, ending at 3,825. The Nasdaq Composite gained 0.9% Friday, but was down 4.1% for the week.
“Right now, the market is trying to stabilize with some real quarterly flows,” said Scott Redler, partner with T3Live.com. Redler said if the start of the new quarter and month does not bring in fresh money and support the market in the next several sessions, that will be a negative sign for stocks and could signal that the market will soon test its lows.
“I think the market is caught between two narratives,” said Redler. “I don’t know if it wants good news or bad news. At first, the hot economic news was bad because the Fed could go another 75 basis points and keep going, but now the market wants softer news. But is the landing going to be soft or hard? It’s like threading the needle right now.”
Redler said he believes the market is in the “7th inning of this correction.”
“If you haven’t sold yet, it’s probably not the time to do it. At this point, it’s a high probability that we test the [S&P 500] low of 3,638, and then it’s just a question of whether we make new lows,” he said. “A lot of people are focused on 3,400 on the S&P 500.”
Strategists say the market will also focus on earnings season, and many expect a choppy reaction once companies begin reporting and lowering future profit guidance. Earnings begin with big banks reporting July 14 and 15.
“The only bullish narrative the market has right now is it can go up on bad news,” said Redler. “At this point, it’s just a matter of how long this contraction will go that the Fed started. They wanted this.”
This past week saw the following moves in the S&P:
(CLICK HERE FOR THE FULL S&P TREE MAP FOR THE PAST WEEK!)
S&P Sectors for this past week:
(CLICK HERE FOR THE S&P SECTORS FOR THE PAST WEEK!)
Major Indices for this past week:
(CLICK HERE FOR THE MAJOR INDICES FOR THE PAST WEEK!)
Major Futures Markets as of Friday's close:
(CLICK HERE FOR THE MAJOR FUTURES INDICES AS OF FRIDAY!)
Economic Calendar for the Week Ahead:
(CLICK HERE FOR THE FULL ECONOMIC CALENDAR FOR THE WEEK AHEAD!)
Percentage Changes for the Major Indices, WTD, MTD, QTD, YTD as of Friday's close:
(CLICK HERE FOR THE CHART!)
S&P Sectors for the Past Week:
(CLICK HERE FOR THE CHART!)
Major Indices Pullback/Correction Levels as of Friday's close:
(CLICK HERE FOR THE CHART!)
Major Indices Rally Levels as of Friday's close:
(CLICK HERE FOR THE CHART!)
Most Anticipated Earnings Releases for this week:
([CLICK HERE FOR THE CHART!]())
(T.B.A. THIS WEEKEND.)
Here are the upcoming IPO's for this week:
(CLICK HERE FOR THE CHART!)
Friday's Stock Analyst Upgrades & Downgrades:
(CLICK HERE FOR THE CHART LINK #1!)
(CLICK HERE FOR THE CHART LINK #2!)
2022: Where Nothing Can Go Right
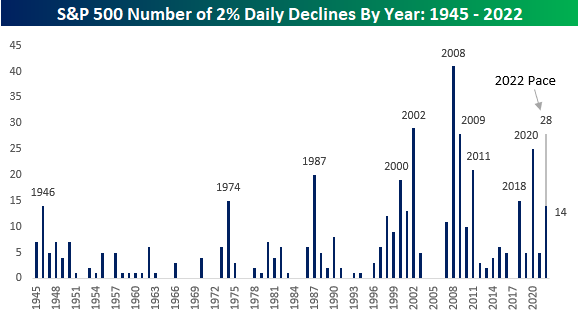
2022 has seen the bulls get slugged with a number of heavy blows. The S&P 500 has already experienced 14 separate one-day declines of 2% or more this year. That's nine more than the entire total for 2021!
While there are still another six months left in the year, only ten other years have seen as many or more 2% daily declines in their entirety! At the current pace, 2022 would see 28 daily declines of 2%+, which would rank as tied with 2009 for the third most in the post-WWII period trailing only 2002 (29) and 2008 (41). Not great company. If 2021 was the year where nothing could go wrong for investors, 2022 has been the year where nothing is going right.
(CLICK HERE FOR THE CHART!)
Strength Follows Weakness
Whether you're looking at monthly, quarterly, or first-half performance, this year's S&P 500 performance has been quite weak. As investors, we must avoid falling into the sunken-cost fallacy and are forced to be forward-looking.
Starting with weak months, there have been a total of 83 months in the post-WWII era in which the S&P 500 declined at least 5%. In fact, this has occurred three times in 2022 alone, and if the current pace continues will top the post-WWII high in 2008 when there were five months of 5%+ declines.
(CLICK HERE FOR THE CHART!)
In addition to 5%+ monthly declines, we also looked at periods where the S&P 500 declined 10%+, as well as six-month periods when the S&P 500 fell 20%+ (with no prior occurrences in the last three months). Over the following day, performance was inline with the historical average following 5%+ monthly declines and 10%+ quarterly declines, but the first trading day following a six-month decline of 20%+ was much better than the historical average. Over the following week and month, though, the picture looks different as performance after 10%+ quarterly declines has been much better than average while performance following 20%+ six-month declines has been well below average. In terms of the week and month after 5%+ monthly declines, returns have pretty much been in line with the historical average.
(CLICK HERE FOR THE CHART!)
Taking a look at positivity rates (percent of the time the S&P 500 has posted gains in a respective period), the S&P 500 has boasted above average rates following a monthly decline of 5%+ in both the next day and month, but rates are lower over the following week. After quarterly declines of 10%+, positivity rates were lower in the following day, but above average for the following week and month, coming in at 61.9% and 71.4%, respectively. On the downside, positivity rates were much lower following the first rolling six month decline of 20%+ in the next week and month, coming in at 40.0% for both. Investors should note that the first occurrence of a 20%+ rolling six month decline occurred on June 16th.
(CLICK HERE FOR THE CHART!)
Gasoline Burning Up
As we noted in today's Chart of the Day, inflation data has been moderating and so too have gas prices as demand has pulled back and refinery output rises as we discussed in last night's Closer. Roughly two weeks ago, AAA's national average price for a gallon of regular gasoline peaked just above $5. Granted it is still elevated, but that price has fallen to $4.86 today. Taking one step further up the supply chain, Gasoline futures peaked even further ago on June 9th and have fallen 14.5% since then. As shown in the second chart below, that decline is now putting the past several month's uptrend on the ropes.
(CLICK HERE FOR THE CHART!)
While both the national average and gasoline futures have been rolling over, the decline in the latter has been far larger as those prices tend to slightly lead retail prices. As for the size of that disconnect, taking the spread of the one-month percent change of the two measures of gasoline is historically wide at 14.4 percentage points. The last times such a divergence has been observed were earlier this spring, last fall, and back in 2020. In those periods, such divergences were short-lived. As shown in the bottom chart where we overall the AAA national average and Front Month Gasoline futures, moves in the futures market tend to lead prices at the pump, in other words, it is unlikely retail prices will continue to fly in the face of lower futures prices.
(CLICK HERE FOR THE CHART!)
(CLICK HERE FOR THE CHART!)
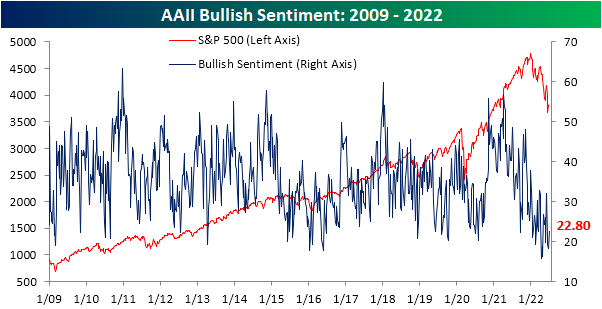
Where Have All the Bulls Gone?
After two weeks of sub-20% readings, the share of respondents to the AAII sentiment survey reporting as bullish has risen back up to 22.8%. That increase in optimism comes on what has been pretty choppy price action in the past week as the S&P 500 had risen then given up roughly 3% since the last update of the AAII numbers.
(CLICK HERE FOR THE CHART!)
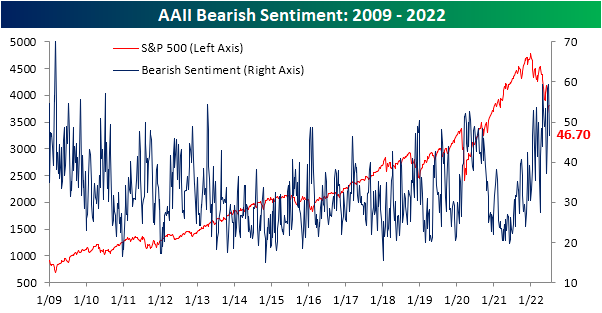
The increase in bullish sentiment broke a streak of back-to-back-to-back declines, and the opposite shift in sentiment could be seen for bearish sentiment. The percentage of respondents reporting as pessimists fell by 12.6 percentage points in the latest week bringing the reading back below 50%. While the double-digit decline was large, the first week of June actually saw an even bigger drop of 16.4 percentage points.
(CLICK HERE FOR THE CHART!)
The significant inverse moves in bullish and bearish sentiment have resulted in the bull-bear spread to move higher, but at -23.9, sentiment continues to heavily favor the bears.
(CLICK HERE FOR THE CHART!)
In fact, taking a four-week moving average of the bull-bear spread shows that the reading has been below -10 (meaning on average bears have outnumbered bulls by at least 10 percentage points) for 23 straight weeks. That continues to close in on the record six-month streak that ended in February 1991 as bulls are few and far between.
(CLICK HERE FOR THE CHART!)
Given the drop in bears this week was far larger than the increase in the number of respondents reporting as bullish, the bulk of the sift went to the neutral camp. That reading rose 8 percentage points to 30.5%. While that only leaves the reading at the highest level since the week of June 9th, it was the largest one-week increase since the last week of March and ranks in the top decile of all week-over-week moves on record.
(CLICK HERE FOR THE CHART!)
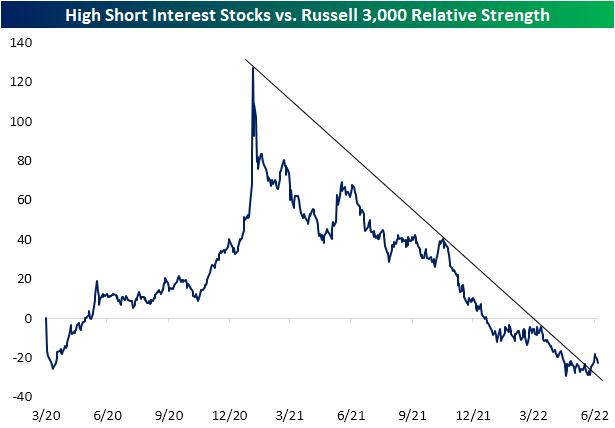
Highest Increases in Short Interest
As we highlighted in a post yesterday, the relative strength of the 100 stocks with the highest levels of short interest against the Russell 3000 has broken its downtrend. This downtrend had been in place since the end of the meme stock mania in January of 2021. Just to refresh your memory, that chart is provided below.
(CLICK HERE FOR THE CHART!)
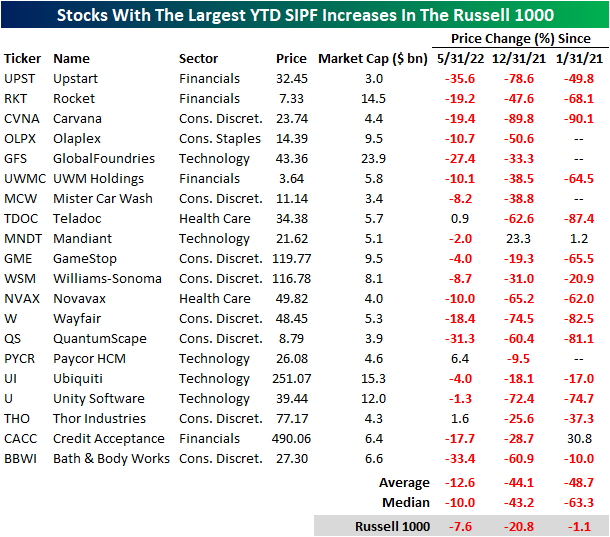
Today, we took a look at the 20 Russell 1000 stocks that have seen the largest increases in short interest as a percentage of float (SIPF) on a year to date basis. Leading this group is Upstart (UPST), the buy now pay later firm that has been decimated as growth stocks have gotten crushed and consumer confidence weakens to historic levels. UPST saw SIPF rise by 27.1 percentage points on a YTD basis and by an additional 2.0 percentage points in June. Notably, UPST appeared on our Top 20 P/S Decliners list as well, which we published yesterday. Unity Software (U) is the only other name to appear on both lists. The largest names on this list by market cap are GlobalFoundries (GFS), Ubiquiti (UI) and Rocket (RKT).
(CLICK HERE FOR THE CHART!)
The performance of these twenty names has been quite weak on a month over month and YTD basis. Additionally, these names have massively underperformed the broader index since the end of the meme stock mania, trading down by 48.7% on average (median: -63.3%) compared to the Russell 1000's loss of just 1.1%. On a YTD basis, these stocks have shed 44.1% of their value on average, which was accelerated by a 12.6% average loss since the end of May. Although it's difficult to find any positivity in these names, they are primed for short squeezes or reversals as shorts cover their positions (which forces buying.
(CLICK HERE FOR THE CHART!)
3% Daily Declines in QQQ
There's no questioning that markets have been extremely volatile this year. Yesterday, the Nasdaq 100 tracking ETF (QQQ) declined by 3.0%, which for 2022, has not been a foreign occurrence. In fact, yesterday was the eleventh time this year that QQQ fell by at least 3%. Since QQQ began trading in 1999, this will be the fifth-highest number of 3%+ daily declines in the first half of the calendar year (top chart below). Although the number of 3%+ daily declines is still well below 2020 and dot-com era levels, it is still a significantly elevated reading. In fact, this year's first-half pace has been well ahead of levels from 2008 and 2009 and is only three shy of the pace in 2020.
Volatility has not been exclusively to the downside, though. On top of the 11 3%+ declines, there have been nine days so far in 2022 in which QQQ rose by at least 3%, bringing the total number of absolute daily moves of 3%+ to 20. This too ranks fifth of all years since 1999, falling five short of 2020 and 31 short of 2000.
(CLICK HERE FOR THE CHART!)
Of all 260 3%+ daily declines in QQQ since 1999, 143 occurred between the start of 2000 and the end of 2002 (the unwinding of the dot-com bubble). During this time, QQQ fell a whopping 74.3%! The chart below shows QQQ since 1999, with the red dots marking each 3%+ decline.
(CLICK HERE FOR THE CHART!)
QQQ's performance following these occurrences is heavily skewed by the dot-com era weakness. While performance over the following week has been slightly better than average versus all periods since 1999, forward returns in the following one and three months have trailed the long-term averages. Since the end of the dot-com bubble burst (2003), forward returns following these occurrences looks much more attractive with QQQ averaging a gain of 44 bps (median: 54 bps) in the week following a decline of 3%+. Over the following month, QQQ has averaged a gain of 1.4% (median: 1.6%) and over the next three months has averaged a gain of 7.3% (median: 7.2%). The positivity rates over the following week, month, and three months have been 57.6%, 58.3%, and 74.5%, respectively.
(CLICK HERE FOR THE CHART!)
Stocks with the Largest Price to Sales (P/S) Declines
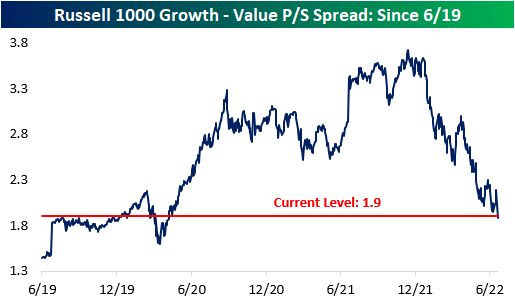
It's no secret that there has been a massive pullback in valuation multiples, and stocks that had higher multiples have been hit much harder by the recent market pullback. This comes as rate hikes increase the discount rate and the era of “free money” comes to an end, which inherently lowers the risk appetite of investors. The chart below shows the price to sales (P/S) spread between the Russell 1000 growth index and the Russell 1000 value index. Naturally, growth stocks should always trade at higher multiples, but the spread became magnified throughout the pandemic. The spread peaked in mid-November 2021 at 3.7, but it has contracted by 1.8 points to 1.9 as of today's open. Whereas the growth index has seen its P/S ratio decline by 36.4%, the value index has only seen a P/S decline of 13.0%. The growth index currently has a P/S ratio of 3.6, compared to 1.7 for the value index. The P/S spread between the two indices is now inline with pre-COVID levels, so the stretched growth multiples of the pandemic-era have come full circle.
(CLICK HERE FOR THE CHART!)
Dissecting this further, we took a look at the 20 Russell 1000 stocks that have seen their P/S multiples compress the most since their respective 52-week highs. Leading this group is Lucid (LCID), which has seen the P/S ratio decline by a whopping 275,309 points. This comes as sales increased substantially and the price declined significantly (-68.2% since the 52-week high). Even still, LCID's P/S ratio remains in the stratosphere at 359. Next on this list is Norwegian Cruise (NCLH) and Carnival (CCL), which have experienced a similar phenomenon. Sales fell off a cliff for the cruise lines following COVID, causing their P/S ratios to spike. As sales have returned on the re-opening and share prices have continued to decline, P/S ratios have fallen significantly. The largest decliners in share price since their respective 52-week highs on this list are Upstart (UPST), DocuSign (DOCU) and Unity Software (U), which have declined by 90.4%, 79.0% and 78.9%, respectively. Upstart has seen its P/S ratio fall from 37.8 down to 3.0. The median stock on this list trades 10.8 times LTM sales, which is still aggressive to say the least. Most stocks topped out either last summer or in October/November.
(CLICK HERE FOR THE CHART!)
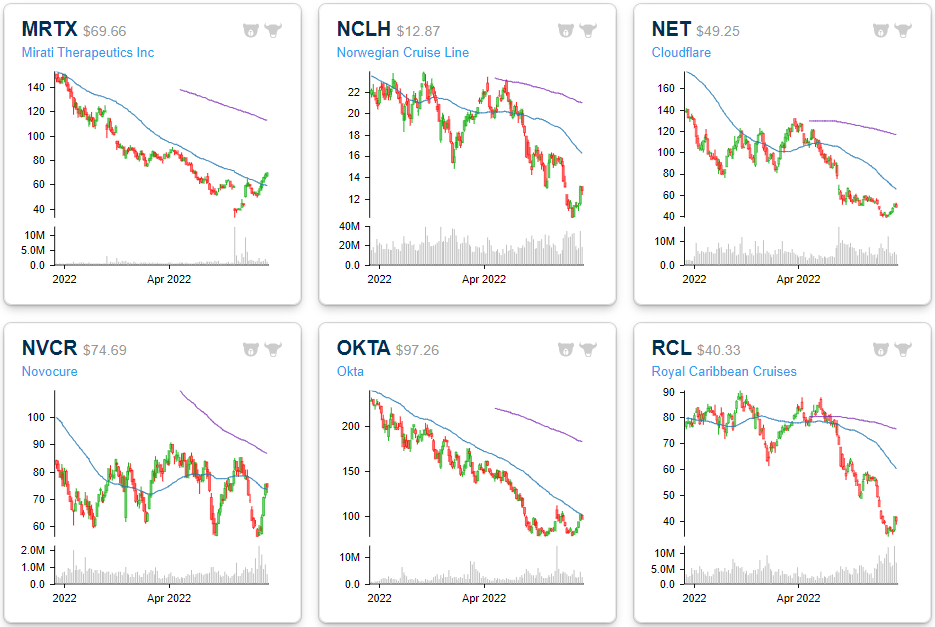
The six month price charts below are available using our Chart Scanner tool. You can click here to view a custom portfolio of these twenty stocks if you're already a subscriber. As you can see, the vast majority are in sustained downtrends. However, if interest rate pressures subside and risk appetites increase, these twenty names could benefit through multiple expansion.
(CLICK HERE FOR THE CHART!)
(CLICK HERE FOR THE CHART!)
(CLICK HERE FOR THE CHART!)
(CLICK HERE FOR THE CHART!)
Stocks on 7+ Month Losing Streaks
The US stock market has been weak and in a downtrend since late 2021, and there are some individual names that haven't been able to post a positive month in quite some time. Of all S&P 1500 members, there are actually eight stocks with a market cap of at least $2 billion that are on a monthly losing streak of seven or more months. Six of these eight names are members of the Consumer Discretionary sector (the worst performing sector on a YTD basis), which is down 27.8% in 2022 (as of Friday's close). The largest company on this list is Nike (NKE), which reports after the close today. The stock would need to gain about 7.5% through the end of the month to break its seven month losing streak. The average stock on this list would need to gain 6.7% through the close on 6/31 to break their respective streaks. Etsy (ETSY) is the closest to breaking its streak, needing to gain just 0.9%, while Under Armour (UAA) is the furthest, needing 13.7%. On a YTD basis, these stocks are down an average of 41.4% (median: -35.0%), meaning they would need to gain ~70% through year's end to finish 2022 in the green.
(CLICK HERE FOR THE CHART!)
Below is a quick look at one-year price charts for these eight stocks. (You can click here to create a custom portfolio of these names if you're a Bespoke client.) Unsurprisingly, these stocks on 7+ month losing streaks are trading in pretty steep long-term downtrends, and they've got a lot of work to do to get back to where they were trading late last year. New uptrends can't emerge until these long monthly losing streaks finally come to an end.
(CLICK HERE FOR THE CHART!)
Here are the most notable companies (tickers) reporting earnings in this upcoming trading week ahead-
- (T.B.A. THIS WEEKEND.)
([CLICK HERE FOR NEXT WEEK'S MOST NOTABLE EARNINGS RELEASES!]())
(T.B.A. THIS WEEKEND.)
(CLICK HERE FOR NEXT WEEK'S HIGHEST VOLATILITY EARNINGS RELEASES!)
Below are some of the notable companies coming out with earnings releases this upcoming trading week ahead which includes the date/time of release & consensus estimates courtesy of Earnings Whispers:
Monday 7.4.22 Before Market Open:
([CLICK HERE FOR MONDAY'S PRE-MARKET EARNINGS TIME & ESTIMATES!]())
NONE. (U.S. MARKETS CLOSED IN OBSERVANCE OF INDEPENDENCE DAY.)
Monday 7.4.22 After Market Close:
([CLICK HERE FOR MONDAY'S AFTER-MARKET EARNINGS TIME & ESTIMATES!]())
NONE. (U.S. MARKETS CLOSED IN OBSERVANCE OF INDEPENDENCE DAY.)
Tuesday 7.5.22 Before Market Open:
([CLICK HERE FOR TUESDAY'S PRE-MARKET EARNINGS TIME & ESTIMATES!]())
(NONE.)
Tuesday 7.5.22 After Market Close:
([CLICK HERE FOR TUESDAY'S AFTER-MARKET EARNINGS TIME & ESTIMATES!]())
(NONE.)
Wednesday 7.6.22 Before Market Open:
([CLICK HERE FOR WEDNESDAY'S PRE-MARKET EARNINGS TIME & ESTIMATES LINK!]())
(NONE.)
Wednesday 7.6.22 After Market Close:
(CLICK HERE FOR WEDNESDAY'S AFTER-MARKET EARNINGS TIME & ESTIMATES!)
Thursday 7.7.22 Before Market Open:
(CLICK HERE FOR THURSDAY'S PRE-MARKET EARNINGS TIME & ESTIMATES!)
Thursday 7.7.22 After Market Close:
(CLICK HERE FOR THURSDAY'S AFTER-MARKET EARNINGS TIME & ESTIMATES!)
Friday 7.8.22 Before Market Open:
([CLICK HERE FOR FRIDAY'S PRE-MARKET EARNINGS TIME & ESTIMATES!]())
(NONE.)
Friday 7.8.22 After Market Close:
([CLICK HERE FOR FRIDAY'S AFTER-MARKET EARNINGS TIME & ESTIMATES!]())
(NONE.)
(T.B.A. THIS WEEKEND.)
(T.B.A. THIS WEEKEND.) (T.B.A. THIS WEEKEND.).
(CLICK HERE FOR THE CHART!)
DISCUSS!
What are you all watching for in this upcoming trading week?
I hope you all have a wonderful 3-day holiday weekend and a great trading week ahead r/stocks. 🙂
Leave a Reply