Good Friday evening to all of you here on r/stocks! I hope everyone on this sub made out pretty nicely in the market this past week, and are ready for the new trading week ahead. 🙂
Here is everything you need to know to get you ready for the trading week beginning May 16th, 2022.
Investors could get a reprieve from vicious stock sell-off in week ahead – (Source)
Investors could get a reprieve in the week ahead from the vicious selling cycle that has gripped the stock market since late March.
Stocks bounced off of Thursday’s washout lows and were set to exit the week with reduced losses after Friday’s rally. Buyers on Friday hunted for bargains among small caps, biotechnology names, the Arkk Innovation ETF and other growth names that were hardest hit.
The S&P 500 jumped back above the key 4,000 level Friday, after touching 3,858 on Thursday — near the 3,800 to 3,850 area that chart analysts have been targeting for a bottom. But while it seems like the market could bounce temporarily, market technicians say that zone will likely be tested again later on.
“Does that mean the lows of the year are in? Probably not, but it could create an oversold bounce back to retest the 4,100 or 4,200 level in the S&P 500,” said T3Live.com’s Scott Redler, who follows the market’s short-term technicals. “In bull markets, you get weeks when you pull in. In bear markets, you get oversold bounces.
Redler said he expects traders to try to sell the rally. On Friday, the Nasdaq surged 3.8% though it was down 2.8% for the week, and the Dow was up 1.5% but down 2.1% for the week. The S&P 500 ended Friday at 4,023, up 2.4%, but down the same amount for the week.
“It has the ingredients for an oversold bounce that might last more than a week. I think this bounce is going to be led by all the oversold names that are down 70% to 80% from their highs,” he said. “It doesn’t mean you can blindly buy. Not everything is going to be created equally in this bounce.”
Redler said the fact that the Federal Reserve does not meet for a few weeks could add some support to stocks. Markets have been nervous that the Fed will raise interest rates too quickly and choke the economic recovery as it tries to snuff out hot inflation.
In the week ahead, investors will continue to look for clues on the course of the central bank’s interest rate hiking path in both economic reports and comments from Fed officials.
Fed Chairman Jerome Powell is slated to speak at a Wall Street Journal conference Tuesday afternoon. For now, the market expects a half-point interest rate hike at the June meeting and another in July, with possibly a third in September. The central bank raised its fed funds target rate by a half point this month, after a quarter point hike in March.
The health of the consumer will be a major focus in the coming week. The economic calendar includes April retail sales and also a look at the housing sector, with the National Association of Home Builders’ survey; both reports are set for release Tuesday, with housing starts coming on Wednesday and existing home sales Thursday.
Walmart, Home Depot and Target are set to report earnings next week, and of these big chain stores could provide good insight into the impact of inflation on consumer spending and attitudes.
Nearly a bear market
Perhaps the most telling thing for investors in the coming week will be just how the stock market trades after its effort to bounce back Friday.
The S&P 500′s dip to 3,858.87 on Thursday took the index to a decline of 19.55% from its high on an intraday basis — very close to the official 20% decline for a bear market.
The unrelenting run up in bond yields also slowed, after the 10-year yield peaked this past week at 3.2%. The 10-year was at 2.93% Friday.
“I think what’s most encouraging to me is the rate rout has stopped. All year long, short-term yields have been pushing up the 10-year yields,” said Jim Paulsen, chief investment strategist at Leuthold Group. He noted that inflation expectations in the bond market have also backed down, and the reduced pressure from the rates market could help stocks rally. Yields move opposite prices in the bond market.
Fairlead Strategies founder Katie Stockton said the slowdown in the 10-year yield’s climb is important. For the broader economy, the 10-year’s run from about 1.5% at the start of the year has already had a impact on housing, since home mortgages are influenced by it.
For stocks, technology and growth names have been most impacted by higher Treasury yields. That’s because higher rates make money more expensive, and cheap money is the fuel for stocks with high valuations.
“I think 10-year yields are just going to be stalled in here,” said Stockton, noting her view is purely based on chart analysis. “Such a steep uptrend is unsustainable. … We believe there’s going to be consolidation in Treasury yields and in the dollar.” She said the support for the 10-year is at 2.55% and upward resistance is at 3.25%.
Paulsen noted that much speculation has been wrung from high-fliers and big cap tech. “Look at the FANG stocks going from 14% of market cap to 9%. A lot of the tech bleed is done,” he said.
Investors were also watching Apple this past week, after it broke support at $150. The stock has an outsized influence on the market, since it is the biggest U.S. company by market cap and is part of the Dow, the S&P 500 and Nasdaq.
Apple stock fell just below Stockton’s target of $139 on Thursday but recovered Friday, to close at $147.11 per share.
Stockton said her chart analysis is signaling the market could see around two weeks of stabilization, either with a bounce or sideways move. “It’s not a buy signal. I’m not recommending people buy.”
There could be an oversold bounce, “and we generally plan to use that oversold bounce to reduce exposure,” she said.
Her downside S&P 500 target had been 3,815, and she said it is still in play. “We have to assume it will be a retest,” Stockton said. “The retest has a higher chance of yielding a breakdown because the momentum is still to the downside.”
This past week saw the following moves in the S&P:
(CLICK HERE FOR THE FULL S&P TREE MAP FOR THE PAST WEEK!)
S&P Sectors for this past week:
(CLICK HERE FOR THE S&P SECTORS FOR THE PAST WEEK!)
Major Indices for this past week:
(CLICK HERE FOR THE MAJOR INDICES FOR THE PAST WEEK!)
Major Futures Markets as of Friday's close:
(CLICK HERE FOR THE MAJOR FUTURES INDICES AS OF FRIDAY!)
Economic Calendar for the Week Ahead:
(CLICK HERE FOR THE FULL ECONOMIC CALENDAR FOR THE WEEK AHEAD!)
Percentage Changes for the Major Indices, WTD, MTD, QTD, YTD as of Friday's close:
(CLICK HERE FOR THE CHART!)
S&P Sectors for the Past Week:
(CLICK HERE FOR THE CHART!)
Major Indices Pullback/Correction Levels as of Friday's close:
(CLICK HERE FOR THE CHART!)
Major Indices Rally Levels as of Friday's close:
(CLICK HERE FOR THE CHART!)
Most Anticipated Earnings Releases for this week:
([CLICK HERE FOR THE CHART!]())
(T.B.A. THIS WEEKEND.)
Here are the upcoming IPO's for this week:
(CLICK HERE FOR THE CHART!)
Friday's Stock Analyst Upgrades & Downgrades:
(CLICK HERE FOR THE CHART LINK #1!)
(CLICK HERE FOR THE CHART LINK #2!)
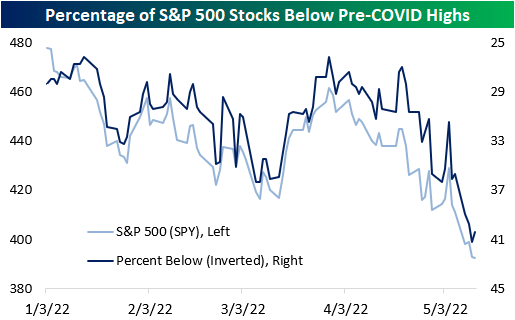
Stocks Near Pre-COVID Highs – 5/13/22
Two days ago, we outlined the percentage of stocks in each S&P 500 sector that were below their pre-COVID highs to show that many of the stocks that surged due to pandemic effects have significantly fallen off, netting long-term holders a negative return since the onslaught of the pandemic. Over the course of the next few weeks, we will be outlining the S&P 500 stocks that are breaking below/above their pre-COVID highs, as we did yesterday. Yesterday, the S&P 500 fell by 10 basis points to close at a new 52-week low, but the index is still up over 15% relative to pre-COVID highs. As of yesterday's close, 40.4% of S&P 500 stocks were below this critical level, an 80 basis point improvement relative to the close on 5/11. 71.4% of utilities and 66.7% of communication services stocks were below their respective pre-COVID highs as of yesterday's close. On the other hand, only 18.5% and 23.8% of S&P 500 stocks in the materials and energy sectors were below their respective highs between the start of 2019 and the end of February 2020. Additionally, 7.8% of S&P 500 stocks were between 0-5% above their pre-COVID highs (39 members).
(CLICK HERE FOR THE CHART!)
Only one stock crossed below its pre-COVID highs for the first time since breaking above that level: MGM Resorts (MGM). However, the stock gapped higher by over 3% today, thus returning above this level. The weak performance as of late is due to a variety of factors including China's zero-Covid policy, the broader market drawdown, and a weak reaction to the latest earnings report, even though the company beat on the top and bottom line.
(CLICK HERE FOR THE CHART!)
One stock traded lower to enter a +2% channel relative to pre-COVID highs for the first time in a couple of months: Jack Henry (JKHY). JKHY is a payment processing and lending firm and competes with the likes of Block (SQ) and Toast (TOST).
(CLICK HERE FOR THE CHART!)
Oh Great, Here Comes Friday The 13th
This is one of the worst starts to a year ever and now we have to worry about Friday the 13th. That’s right, tomorrow, May 13, will be the first Friday the 13th since August 2021. For most people, this is just another day, unless you suffer from triskaidekaphobia—the fear of the number 13. A fear of the actual day of Friday the 13th is called paraskevidekatriaphobia or friggatriskaidekaphobia.
“Fortunately, the unlucky nature of Friday the 13th hasn’t tripped up U.S. stocks recently. In fact, the past four times Friday the 13th came around saw gains,” explained LPL Financial Chief Market Strategist Ryan Detrick. “Now the bad news: May hasn’t been kind to this day, down the past three times.”
As shown in the LPL Chart of the Day, the S&P 500 Index has struggled some when a Friday the 13th takes place during the month of May.
(CLICK HERE FOR THE CHART!)
Taking things a step further, do we all hate Monday? Turns out stocks would agree, as this is by far the worst day of the week, with Wednesday actually the best.
(CLICK HERE FOR THE CHART!)
2022 has been bad pretty much all around, but it turns out Wednesday is once again the best day of the week, and it really isn’t even close, although it didn’t hold true yesterday.
(CLICK HERE FOR THE CHART!)
If it feels like this year hasn’t had many green days, that is probably because that is quite true. In fact, in 2022 only 43.3% (39 out of 90) of the days have seen the S&P 500 Index finish higher. The good news is we expect this number to mean-revert and we’ll see more green days before 2022 is all said and done.
(CLICK HERE FOR THE CHART!)
As rough as this year has been, how does this correction stack up with other corrections? Currently, the S&P 500 is down 18% from the January 2 peak and it has been 128 days. Looking at all the corrections since 1980 shows the average one ends at about 88 days, so this correction is getting long in the tooth and could be nearing its conclusion. Additionally, the good news is a year off the correction lows, stocks have been higher 22 out of 24 times with an average gain of 23.0%.
(CLICK HERE FOR THE CHART!)
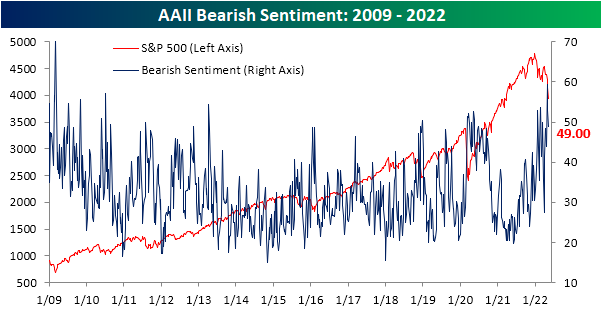
Sentiment Just Like Bear Markets
The past week may have seen the S&P 500 and other major US indices breach to fresh lows on steep declines that are nearing bear market territory, but the AAII sentiment survey has not fallen to its own lows as might have been expected. Bullish sentiment fell back below 25% this week but is still several percentage points above the lows in the teens from only a few weeks prior.
(CLICK HERE FOR THE CHART!)
Historically, when the S&P 500 has hit 52-week lows as it has in the past week, bullish sentiment has usually been even higher with an average reading of 29.15%. The chart below shows the levels of bearish, bullish, and neutral sentiment in the AAII survey at the time the S&P 500 first traded into bear market territory (down 20% from a prior peak) for each bear market since the survey began in 1987. At 24.3% now, the current reading of bullish sentiment is on the low side compared to prior bear markets. The only two bear markets where bullish sentiment was lower were July 2008 and February 2009.
(CLICK HERE FOR THE CHART!)
Although bullish sentiment declined, bearish sentiment also pulled back below 50% for the first time since the week of April 20th. Even with the decline, though, bearish sentiment remains at a historically high level.
(CLICK HERE FOR THE CHART!)
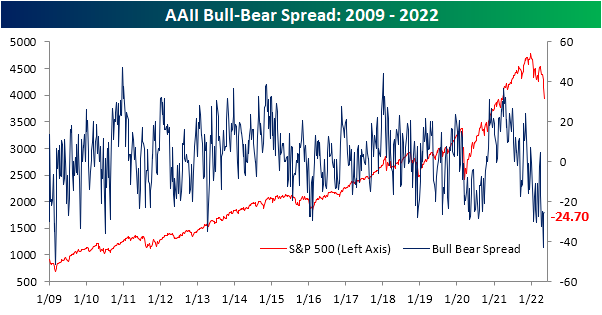
Given the moves, the bull-bear spread was higher for a second week in a row after it had reached the lowest level since March 2009 two weeks ago. Again, in spite of those improvements, the current level remains in the bottom 5% of all weeks on record.
(CLICK HERE FOR THE CHART!)
The year is already a third over, and sentiment has found no respite after multiple months of declines in equity prices. In fact, bullish sentiment has not seen a single week with a reading above its historical average, and there has only been one such week for bearish sentiment. In the charts below, we show the average bullish and bearish sentiment reading by year since the start of the survey in 1987. While there's still a lot of time left for things to change, with an average bullish sentiment reading of just 24.42% at this point in 2022, this year ranks as the worst year for bullish sentiment in the history of the survey (since 1987), although 1988 and 1990 have come close with average readings of around 27%. Meanwhile, the average reading on bearish sentiment has been 44.3% this year. 2008 is the only other year with a higher average reading at 45%. In other words, it is hard to find a comparable year since the late 1980s where optimism has been this low and pessimism this high.
(CLICK HERE FOR THE CHART!)
Update: 1970 Redux vs. 1962 & 1974?
Last week I illustrated how eerily close 2022 is tracking 1970. This disturbing comparison is not abating. Two other comparable bear market years have also come to light. 1962 and 1974: both midterm years with similar chart patterns.
1962 had the Cold War machinations and the Cuban Missile Crisis, but rates, inflation and oil prices were nothing like 2022. 1974 on the other hand had it all. Q1 GDP was negative, inflation surged, Oil Crisis and war in the Mideast.
1960 was removed since it held the March low until September and was an election year. We also looked at 1969 and 1994 which have some similarities and have been bandied about over the transom. But 1969 was not down in April and flat the first four months. Though 1994 was a midterm year it was flat not down like 2022 with a low in March.
We still expect a classic midterm bottom over the next several months. Where it bottoms is anyone’s guess. We have ours. But we are reminded of an old sign we used to have in the office about picking downside targets. It said one thing, don’t do it.
(CLICK HERE FOR THE CHART!)
Here are the most notable companies (tickers) reporting earnings in this upcoming trading week ahead-
- (T.B.A. THIS WEEKEND.)
([CLICK HERE FOR NEXT WEEK'S MOST NOTABLE EARNINGS RELEASES!]())
(T.B.A. THIS WEEKEND.)
([CLICK HERE FOR NEXT WEEK'S HIGHEST VOLATILITY EARNINGS RELEASES!]())
(T.B.A. THIS WEEKEND.)
(CLICK HERE FOR MONDAY'S PRE-MARKET EARNINGS RELEASES!)
Below are some of the notable companies coming out with earnings releases this upcoming trading week ahead which includes the date/time of release & consensus estimates courtesy of Earnings Whispers:
Monday 5.16.22 Before Market Open:
(CLICK HERE FOR MONDAY'S PRE-MARKET EARNINGS TIME & ESTIMATES!)
Monday 5.16.22 After Market Close:
(CLICK HERE FOR MONDAY'S AFTER-MARKET EARNINGS TIME & ESTIMATES!)
Tuesday 5.17.22 Before Market Open:
(CLICK HERE FOR TUESDAY'S PRE-MARKET EARNINGS TIME & ESTIMATES!
Tuesday 5.17.22 After Market Close:
(CLICK HERE FOR TUESDAY'S AFTER-MARKET EARNINGS TIME & ESTIMATES!)
Wednesday 5.18.22 Before Market Open:
(CLICK HERE FOR WEDNESDAY'S PRE-MARKET EARNINGS TIME & ESTIMATES LINK!)
Wednesday 5.18.22 After Market Close:
(CLICK HERE FOR WEDNESDAY'S AFTER-MARKET EARNINGS TIME & ESTIMATES!)
Thursday 5.19.22 Before Market Open:
(CLICK HERE FOR THURSDAY'S PRE-MARKET EARNINGS TIME & ESTIMATES!)
Thursday 5.19.22 After Market Close:
(CLICK HERE FOR THURSDAY'S AFTER-MARKET EARNINGS TIME & ESTIMATES!)
Friday 5.20.22 Before Market Open:
(CLICK HERE FOR FRIDAY'S PRE-MARKET EARNINGS TIME & ESTIMATES!)
Friday 5.20.22 After Market Close:
([CLICK HERE FOR FRIDAY'S AFTER-MARKET EARNINGS TIME & ESTIMATES!]())
(NONE.)
(T.B.A. THIS WEEKEND.)
(T.B.A. THIS WEEKEND.) (T.B.A. THIS WEEKEND.).
(CLICK HERE FOR THE CHART!)
DISCUSS!
What are you all watching for in this upcoming trading week?
I hope you all have a wonderful weekend and a great trading week ahead r/stocks. 🙂
Leave a Reply